Calculation of the motivation of a master engineer. Key performance indicators for the energy service of an industrial enterprise. Relationships in the team
Today we are talking about the KPI-Drive system, management by goals and proper motivation of employees with Gulmira Ismanova, quality director of the Shoro company from Kyrgyzstan. Mira knows her company very well, having worked there for 14 years. Starting as a simple operator, she reached her current high position. We are confident that Shoro’s experience will be useful to both our clients and those who are just getting acquainted with Alexander Lityagin’s technology.
- Hello, Gulmira! Thank you for agreeing to give us an interview. Please tell us about your company.
- Hello! “Shoro” (www.shoro.kg) has been on the market for 22 years. Our mission is formulated as follows: “Revival of ancestral traditions based on the production of environmentally friendly products and drinks.”
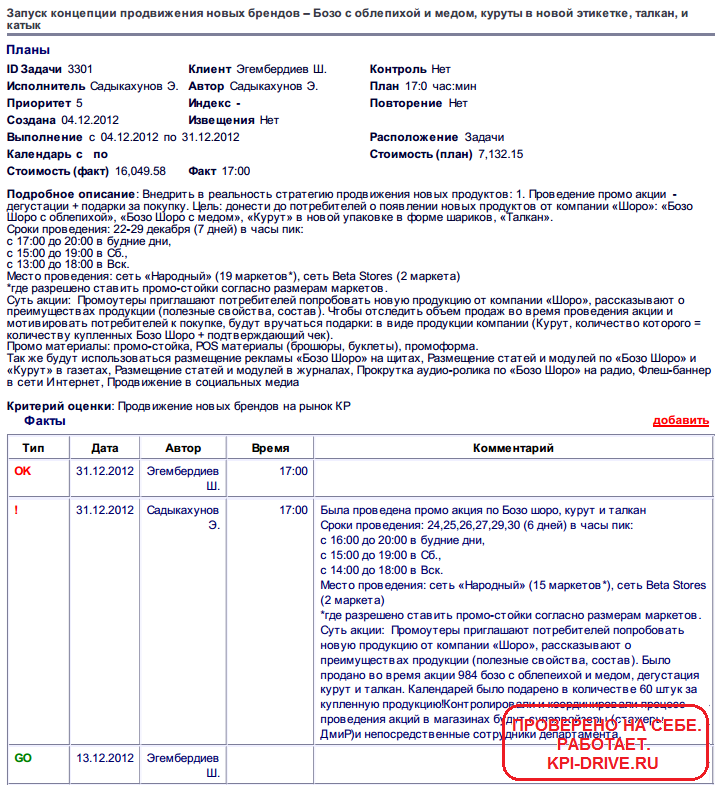
Today we have grown to the level of a large republican company; we produce a whole series of mineral drinking table waters, as well as national drinks, among which there are cereals, which are very healthy, and fermented milk (ill. 1). Let me note that our drinking mineral waters are very popular in Kyrgyzstan: according to last year’s data, they occupy approximately 63% of the local market.

Il. 1. Products of the Shoro company
Our business is seasonal, we have drinks on tap, so in the summer we increase our staff to approximately 1,200 employees. But the main core is about 300 people.
- What can you say about the structure of the company?
‑ We initially identified 14 users. These were mainly directors and heads of those departments that influence product quality - heads of departments: supply, vehicle fleet and, of course, sales, including regional ones. We immediately divided them into groups with a “manager – subordinates” hierarchy. We included the first deputy general directors (we have two of them), as well as the financial director, among whose subordinates is the head of the procurement department.

Il. 2. List of employees in KPI-Drive, subordination and performance
- Why did you choose the KPI-Drive program?
- Before the selection and implementation of this program, we had a certain reward system. We have our own production, and all sales specialists were tied to the production of piece products. But it was not particularly clear how exactly to evaluate administrative and managerial personnel. Therefore, the question arose about the effectiveness and efficiency of these people. The wage fund was simply divided into salary and bonus parts.
Before we heard about the KPI-Drive program, our company already had its own reward system, which was once developed on the basis of grading. We divided employees into workers, specialists, leading specialists, line managers and directors. Unlike those categories of employees whose tariffs were tied to the production and sales of units of production, we had questions mainly regarding the remuneration system for directors and line managers. The problem was in calculating salaries specifically for directors, because their work was assessed by our general manager. And the system was built in such a way that their salary and bonuses were related to each other as 70/30, where the first figure is the fixed part and the second is the variable. At least that was the assessment of the first leader.
But then the indicators were not determined precisely. And, of course, the general director had questions every time: “Why should I put 30%? Because the person is so good? But I don’t see work, I don’t see results! Are there any criteria for assessing their activities? And there were many such questions. As a result, we were offered the KPI-Drive program. By the way, in Kyrgyzstan, training on KPI systems has become very popular.
- Did this proposal come from the official partner of the Target Management company in Kyrgyzstan, Rysbek Bekembaev?
‑ Yes! Our CEO was looking for a simple system that would spell everything out so he could know exactly what salary to give his employees based on performance metrics. He always wondered this question. Although this suited us quite well: in order not to offend the person, he was always given a 30% bonus. But it was inconvenient for the CEO.
Kyrgyzstan is a small republic, everyone here knows each other. Therefore, when we started talking about this at our meeting, Rysbek, as we call him in a friendly manner, said: “There is such a program!” We invited him to our company and he gave a presentation to all our managers.
Then the general director noted: “The KPI-Drive program is good, especially since it is automated. If we say that we must be an innovative company, then let's be the first to implement it! Why not? If there are certain indicators, weight distributions, facts, then I will know exactly who I’m paying for and for what.”
And this was the first reason why we introduced this program (Table 1).
______________________________________
Table 1. Selecting a KPI-DRIVE software product
We always asked the question: “Can I earn more?” For example, there is a certain minimum wage of 30 thousand soms. And if the fixed part is 70%, and the bonus part is 30%, then, of course, I will receive this amount. But many diligent employees could have earned more, but they could no longer jump above this level.
And so, when we were presented with the KPI-Drive program, everyone’s eyes lit up because, it turns out, earnings could be higher. This program allows you to evaluate your labor contribution according to its merits. Are you trying? Get more than what you installed! This became the main motivation for employees.
- Previously, employee evaluations were biased?
‑ Yes, biased. It seems that one employee is trying, and the second is trying even harder, but it is still not very clear who and how to evaluate. And when the general director got acquainted with Alexander Lityagin’s technology, he liked that there were clear criteria. And he proposed to determine wages based on KPI indicators.
- What were the goals of implementing KPI management in your company?
- First of all, it was the motivation of the employees: they saw that they could earn more than was previously established. Secondly, they began to understand that there are certain standards and a person must fulfill his duties according to developed and written job descriptions. Although for some reason we didn’t pay attention to some business processes before...
Then questions arose: who will set the tasks? And which ones exactly? Of course, these job descriptions came to our aid here. And immediately everyone began to understand their functions and responsibilities (Table 2).
______________________________________
______________________________________
Table 2. Goals of implementing KPI management and the KPI-DRIVE system
We also wanted to distinguish between everyday and project tasks. Let’s say we are preparing to put into operation a new center for the production of mineral water. In this case, the task is posed as follows: after some certain time we launch the workshop, for this you are given this and that. All!
The project task is divided into several months, it can even be extended for a year. We encountered this when our chief engineer set the tasks. It was then that we realized that, for example, the new workshop, it turns out, has been doing something for eight whole months. And, most importantly, such design tasks need to be set!
When an employee breaks down a project task by month, he accurately tracks its completion. This helped us all a lot. Those current tasks that arise along the way fade into the background. But project tasks are controlled and always completed!
- That is, the first priority is the design tasks, because they are the most important?
- Yes Yes! We review our investment plan annually. The company is developing, the plant is expanding, we will definitely implement some promising projects. It doesn’t happen to us that we just get up and do nothing. Therefore, project tasks concern everyone - the HR department, the financial director, the marketing department, and the chief engineer.
Previously, our project tasks were stuck. We often stated that “we will finish the project around the end of the year.” But now people have begun to say: “Why wait until the New Year? Let’s finish everything in October.” Then we break down the tasks by month, and their implementation is monitored by the CEO. This is great!
Thus, the principle of planning “in about eight months” no longer works. When the program itself says that an employee must set precise deadlines and calculate resources sufficient to complete this task, then the person begins to think. And in this case, the specific task turns out to be more accurate. Everyone began to know for sure that this project needed to be completed, for example, in exactly seven months. And current tasks began to be tied to project ones. And that's normal! And we, the employees, really liked the fact that we began to separate them.
It is very convenient for both the general director and his deputies to work in the KPI-Drive program: all the numbers are visible, and not at the end of the month, but daily. The good thing about the goal-based management system is that it reduces the time it takes to calculate salaries manually (we still have paper versions for calculating them). And, of course, Alexander Lityagin’s technology is also convenient as a reporting form.
- Please clarify: were fines ineffective before the implementation of the KPI-Drive system?
- When we said that we have penalties for failure to complete certain tasks, the employee immediately turned out to be demotivated: supposedly he was doing some work, but he was still told that it was ineffective. Therefore, when this or that specialist decides for himself what exactly he must do and what exactly he will receive money for, he no longer thinks about fines.
- It turns out that the employees’ thinking is becoming different?
- Interesting. How did employees feel about the KPI-Drive program at the beginning of implementation?
- After the presentation of the program took place, we first identified its users. I have already said that as such we chose directors and some heads of the department, 14 people in total. Our team is predominantly young, everyone understands perfectly well that something needs to change for the better in the company and in life. We no longer have such conservatives in our company as during the Soviet Union. Of the “old-timers”, only me and the chief engineer Nadezhda Vasilievna Voroshilova are the only ones. And mostly young people work for us. She doesn’t struggle and say, “Oh God, I don’t like this program, why do we need this?” Everyone completed training and decided to work in the KPI-Drive system.
In general, 70% of employees immediately understood Alexander Lityagin’s technology well and accepted it. There were two or three people who misunderstood the KPI-Drive program in technical terms, in particular, what tasks to set and where. Therefore, I, as the project leader, had to explain to them what tasks could be set and how many hours should be allocated to complete them. But they understood the main thing, and that was already good.
- Tell me, for which positions were the matrices developed easily, and for which were there difficulties?
- For a position, for example, production director, it was easy to create a matrix. For the director of HR, there were some difficulties in reflecting indicators, especially since he did not have the same ones as now.
- Please explain what HRM is?
- This is human resource management. When choosing a user, it turns out that you need to look at the importance of this position in the company: when we hired an assistant manager, some difficulties arose regarding what indicator to determine and how many hours to assign.
Rather, these were minor difficulties, since we encountered this for the first time. Assistant manager, who is he? Image maker of the CEO? In short, a lot of questions arose, and we began to describe in general all the functions of an assistant manager, what he should do. So for a long time we could not determine the matrix of this particular position. But we dealt with the rest pretty quickly.
- You once talked about such an interesting point: working with the KPI-Drive system, you have formed a corporate culture in which an employee himself “sells” his tasks to managers. Tell us how this works in your company?
- Initially, when Rysbeck presented the KPI-Drive program, he mentioned that it would be very interesting for an employee when he himself gives birth to an initiative, creates a task, presents it to the manager, and, telling how and what he will do, in what time frame and what the result will be, “sells” it.
We were very interested in this, because before this the employee, while working, expected his boss to set some kind of task. Sooner or later, a moment comes when the manager gets tired of all this. And he begins to think like this: “Why should I think if I have employees?” In my opinion, we simply “matured” then. For some reason, everyone suddenly said that they really like to “sell” their tasks themselves. And here’s what’s interesting: previously, within the framework of their functional responsibilities, employees had relatively few tasks. But here it’s the other way around: people began to set themselves tasks that led to improvement in the company’s performance. They started offering something...
- Promising?
- Yes exactly! Our first meetings on the implementation of the KPI system were held every Thursday. Then all 13 people, except for the administrator, were directly subordinate only to the first deputy general director. We opened the matrix of each user, and he talked about his tasks: “This week I have to do this, and I also want to do this and that.” And it was very interesting! Competition arose because everyone had their own task. For example, a commercial director became interested in my task. He immediately “connected” and began to offer something. Probably, in these first two months, the most interesting thing for us was “selling” our tasks.
At first we did it all together because it was a little difficult. There was no such thing as employees creating tasks themselves and then presenting them, but at the same time not paying attention to me as the project leader.
Our Deputy General Director is a very interesting person. And if he says that he will not accept this or that task, then they will “sell” him another. We even had something like a game. We often laughed and said: “If the Deputy General Director does not want to “buy” our task, then let’s come up with the next one.” In those first two months we worked as a team in this way. He probably did this deliberately at first (as if he did not accept the task), inventing various reasons for this, so that people would become interested and would get away from the routine. It was very interesting!
By the way, we still have this practice: every Thursday we present our tasks and “sell” them. True, we are now divided into two blocks - according to the number of deputy general directors. Each of them oversees their own direction. It is to them that subordinates report and “sell” their tasks. The deputies accept them, give the go-ahead, and off they go.
- Tell me, what advantages do employees have today?
- The program gives them the opportunity to earn more compared to a fixed payment. I have already said that we have a limit, and not all employees reach it. Good employees, for example, me or the director of HR, get more. Also, “sales people”, of course, if they exceed the “ceiling”, they earn much more.
- And what is the “ceiling”?
- The bar was set higher for them than for us. If we have 100%, then the “sales people” have 150%.
There is one more nuance that concerns standard things. For example, in order to receive a bonus, a person must do a much better job, literally perform a feat. Yes, yes, laughing, we call it a feat. But the management always notes it and, of course, provides additional payment. Moreover, everyone already knows: if you accomplish a feat, you get +2. Which directly affects the level of your salary, and, of course, also motivates.
And one more thing: they still see in the matrix who has what percentage of performance. And then the competitive spirit appears! Employees say: “At the end of the month I will definitely do more than you, I can do it!” Yes, we have had such moments, and they help us quickly understand where we need to adjust our behavior. Or do something to achieve much greater results than planned.
- Let's look at the KPI matrices of Shoro company employees: the first matrix is the deputy general director (ill. 3).
- This matrix consists mainly of indicators of all users who are subordinate to him - both “sales people” and production workers. These are general indicators, and based on their results, the performance of the deputy general director is compiled. Although it is not evaluated at all.

Il. 3. KPI matrix of the Deputy General Director
- It turns out that this is just information for him?
‑ Yes, because he looks at the data only from his subordinates. The picture throughout the company is clear in the palm of your hand.
- Let's move on to the KPI matrix of the financial director (ill. 4).
Il. 4. KPI matrix of the financial director
- Here’s what’s interesting: before creating a matrix of all users in general, we had the question that we first need to determine the indicators. Then we had to set weights for everything - for tasks, for indicators, for evaluation, then - the amount that we should allocate to the main and bonus parts, as well as - the number of hours to complete tasks. And in this regard, we have encountered certain difficulties. We were not immediately able to determine the indicators, but simply set them based on job descriptions.

Il. 5. Tasks of the financial director
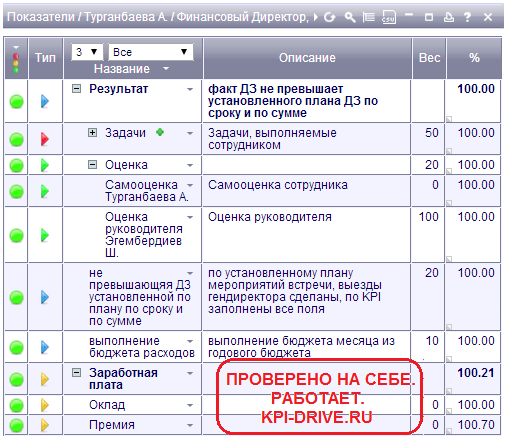
But the tasks in the financial director’s matrix take up 50% of the weight (Fig. 5). The fact is that the strategy was initially set for the financial director that his department should have a lot of tasks each year. That’s why we “weighted” the indicator by 50%. And, of course, there is a standard KPI of 20% - assessment (self-assessment and manager’s assessment).
-Can you comment on these tasks?
‑ It would probably be more correct to immediately set the hours, depending on the position or specifics of the work. But initially it was said like this: “Let’s try to put an average value, because there are so many hours in a week, so many in a month, we will transfer half of them here to KPI-DRIVE, and the rest, about 40 hours, Let’s leave it to carry out current affairs.” They assigned 100 hours to everyone, distributing them over a month.
Then problems began to arise. Where, for example, carbon dioxide is being calculated, she set it to five hours, but the frequency was not established. Questions arose about when and what was done. Sometimes users closed their tasks late...
Then we began to define hours and tasks from Monday to Saturday. When we started setting tasks week by week, everything immediately became clear and well understood.
- Has this increased the discipline in completing tasks?
- Yes! Firstly, the employee already knows what is “on fire” and what urgently needs to be done. Secondly, there is constant control by the manager. He looks at it all the time and says: “Your task was supposed to end on February 20, but you have it hanging.” It is also good.
- Do you always check completed tasks at the end of each week?
‑ This is how our work begins. We open the program, and the general director says: “You were given the following task. Have you completed it? Is everything done well?" If there is an exclamation mark, then he continues: “That means that’s it, I’m closing the task.” And he immediately presses the OK button right in front of everyone who is sitting in his meeting. And this is how we look at the tasks every week, whether they are completed or not. And the manager’s assessment also goes by week.
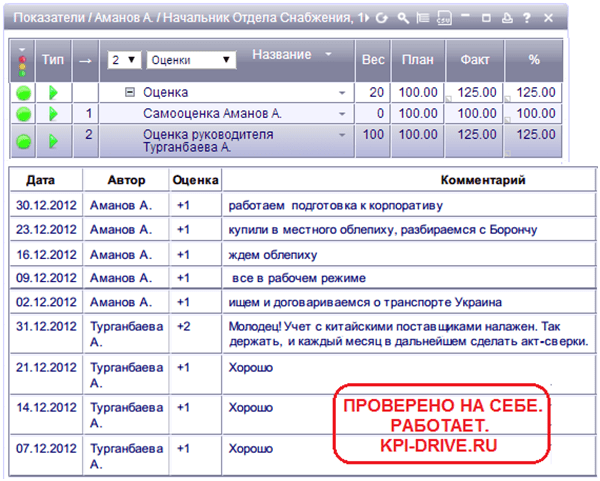
If we talk about the KPI matrix of the head of the supply department (Fig. 6), then he also had two indicators: 100% compliance of strategic raw materials and components with the company’s specifications and complete fulfillment of requests approved for this period. We put 15% on each of these indicators, on tasks - 50%, on assessment - 20%. Total – 100%.

Il. 6. KPI matrix of the head of the supply department
We immediately developed a reporting form. For example, the head of the supply department is assessed by indicators by the quality director, because the control of all strategic raw materials and components passes through the laboratory and is checked by the quality department.
The second assessment is made by the production director, since the head of the supply department must fulfill all his requests within the period approved for the month. Therefore, the assessment of the internal client has already begun here. We have developed a reporting form for both the first and second indicators, and the task weighs 50%.
- What components does the assessment of the work of the head of the supply department consist of?
- From self-assessment and manager’s assessment. We have established a weekly frequency for employees to evaluate themselves. On Mondays, the manager does this (ill. 7).
Il. 7. Evaluations of the head of the supply department and comments on the evaluations
There are standard things, or rather, written criteria. Therefore, usually all users give +1. We mostly employ people who treat themselves fairly. And very rarely employees give themselves a +2, because they think that “I’m already doing the job.”
- They think it’s their duty?
- They believe that this is not a feat, but simply a good performance of their duties.
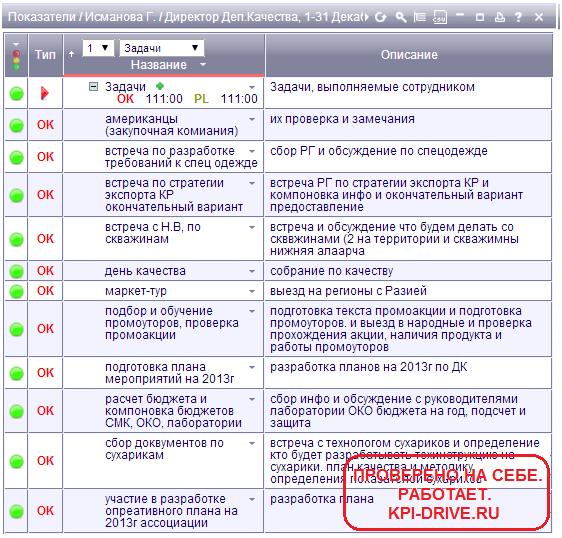
- Explain why it happens that sometimes comments are written long, but in this case they are short?
‑ There is no such need, because everything is simple here. For example, the same head of the supply department A. Amanov writes: “I did this, everything works as usual.” And the assessment by the manager is made by the financial director A. Turganbaeva. If she writes “good”, this means that everything is just fine. When she is delighted with something, she can write “Well done!” Her KPI accounting is set up in such a way that she immediately praises and immediately writes: “You always need to do a reconciliation report” (ill. 7).
- Often users of the KPI-Drive program do this: if everything is fine, then they simply put +1 without any special explanation, and if there are already deviations, then they are explained additionally.
- With us, if you put +1 in the program, you must add a comment. Some bosses write a lot. For example, our marketing director. He himself is a very sociable person, that’s why he writes everything in detail in the comments. But the head of the supply department always has no time, he is always “in procurement”. Therefore, he writes his assessment briefly.
On the issue of remuneration for the head of the supply department (ill. 8). His salary consists of 60% salary and 40% bonus. This ratio is the same as for all department heads and managers. This was the case initially, when we were just creating matrices. For comparison: for directors the ratio of the fixed and variable parts of their salaries is 70 to 30, for “sales people” it’s the opposite, for them it’s 20 to 80.

Il. 8. Payment of the head of the supply department
We had this installed initially, so we didn’t change anything here, saying: “Let’s try to work according to this scheme.” And immediately the formulas were compiled like this.
We set the level of self-esteem for “sales people” at 150%, although for all others it is 120%. Once there was a moment when our commercial director made 133%. You could say we were all shocked, we were happy for him that he achieved such results.
People ask the same question all the time: “Why did we get 120% and not 150%?” But we made preliminary calculations and estimated that if our employees work so well that they do 150%, then our wage fund will increase noticeably. And then the shareholders will ask questions: “What did you do? Why has the payroll increased so much? Therefore, we immediately told ourselves: “Let’s work at 120% for now.” Sellers need to be motivated more strictly, which is why we made them a larger variable part.
- Let's move on to the next matrix (ill. 9).
‑ In the KPI matrix of the quality director, in addition to standard KPIs (tasks and assessments), there are two indicators: the percentage of complaints resolved and 100% compliance of the company’s processes with the developed procedures. Weight - 15% each.
We have decided that we may have to review the metrics if they have a financial impact on your performance. And we had such a moment! After some time, we set a different indicator to the financial director. Previously, it sounded like this: “The fact of accounts receivable should not exceed the established plan in terms of time and amount.”
But when they began to analyze the results six months later, the financial director said: “This indicator does not directly affect me, these are sales, they have set deadlines and amounts. And I don’t influence him in any way either. Better set me some other indicator.” Indeed, the state of receivables in no way depends on it. That's why we set a different indicator for her. It seems that it was tied in terms of quality and timing, just like the previous director.

Il. 9. KPI matrix of the quality director
- So, regular collection of statistics helped you clarify the situation?
- Yes, at the same time, everyone began to think about their own indicators, how they could influence them or make them better.
For example, in the quality director’s matrix, the first indicator is the percentage of complaints resolved. Yes, they do, and that’s normal. But we need to determine their objectivity, and then also resolve them. Therefore, this indicator was established.
For us, this specialist (that is, me) is also a representative of the quality management. We have implemented a quality management system and have developed many procedures. And it is imperative to monitor their implementation. Therefore, the quality director’s second indicator is 100% compliance of the company’s processes with the developed procedures. There is a schedule, there are certain deadlines, and every month I essentially conduct an internal audit of all business processes in the company. We have developed 140 procedures, both internal and mandatory, which are required by all quality regulations.
My tasks are already 50% (they thought it was very important), and the manager’s assessment is another 20%. Every month we set ourselves a task plan of 100 hours and “sell” it to the manager.
- Tell me, there are usually 168 hours in a month. But it turns out that there are 100 effective tasks. Do you devote the remaining hours to “routine”?
- We initially calculated and decided that 100 hours are needed to complete effective tasks. But you still need to take into account the specifics of each position.
We set the hours for each employee differently, because we immediately thought about all the subtleties. At first they thought that 70 hours would be normal. But in practice it turned out that, for example, a marketing director needs more than 100 hours, because all his work is related to the tasks that he sets. But the head of the sales department has a daily routine job, and he doesn’t have to invent anything to get 100 hours.
- Yes, the director says to me: “Where will I get so many more hours? Why should I do this? Basically, these are those managers who do the same work every day. Of course, only later we began to regulate these processes, or rather, set the clock, taking into account the work performed.
- Please tell us about the tasks in your matrix.
— This is what the list of my tasks and their description looks like (Fig. 10).
Il. 10. Tasks of the quality director

Il. 11. Example of the “Quality Day” task in the KPI-DRIVE matrix
- For example, the task “Quality Day” - we have such days on Fridays (ill. 11). We hold meetings where we discuss how many and what kind of products were released in a week, what inconsistencies we had, whether there were any complaints, we sort them out, determine the reasons, set tasks for people, and record these processes. And on Monday at the planning meeting I report to the general director. Then he asks questions about what has been done and what has not been done, who is doing it and how, and so on. In a word, an ordinary operational thing. Quality Day is part of the quality management system that we have implemented.
As you can see, I write comments as the task progresses: “Issues regarding 19-liter water were discussed.” Then they discussed the problem of returning defective bottles and how to solve it, and this takes some extra time. It is calculated and added to where we set the task.
- And here is the revealed task in your matrix: “Continuing work with the vehicle fleet” (ill. 12). Your comments?
‑ This is a weekly task. We meet with each manager for four hours, developing job descriptions and processes. We have a very large fleet of vehicles. Various moments arose, the structure changed, new people came, for example, a control mechanic and a traffic rules engineer - these are the positions that appeared. Naturally, those functions that were previously performed by other people were transferred to newcomers. Therefore, it was necessary to re-develop job descriptions and processes specifically for these employees.
I divided the task into several weeks, which is why I wrote it in my matrix. I also continued to work on the repair and inspection processes. Of course, I set it to 20 hours, because that’s about four hours, five days a week.

Il. 12. Example of the task “Continuing work with the vehicle fleet” in the KPI-DRIVE matrix
- How does the director evaluate your work?
- We have different reporting formats, including a protocol. Therefore, when we close our tasks and indicators, we attach the file (Fig. 13).

Il. 13. Quality Director’s assessments and comments
- Let's move on to the matrix of the chief engineer.
- The main indicator is the production plan, weight - 10%. Since she is fully responsible for our equipment, the “Number of downtime hours” was also included in the matrix with a weight of 20%. Accordingly, the task and assessment are 50% and 20%, totaling 100%.
For the chief engineer, the indicators are mainly tied to the quality of the equipment. We gave her 30 hours a month for this. And here’s what’s good about us: either the equipment is working properly, or Nadezhda Vasilievna is working hard for us. During all this time, her downtime did not exceed a certain coefficient (Fig. 14).

Il. 14. KPI matrix of the chief engineer
The second indicator in the chief engineer’s matrix is the production plan. Expressed in pieces. She is interested in fulfilling the production plan and releasing as many copies of the product as possible.
And her tasks are the same, related specifically to equipment. For example, accepting part of the motor park equipment, preparing the site and unloading.
‑ But the current task is “Searching for a supplier.” A supplier has been found, bottles and stubs have been sent to him for examination, and the contract is planned to be signed after the New Year (ill. 15).

Il. 15. Example of a chief engineer’s task in the KPI-DRIVE matrix
- Why did it take 16 hours to complete the task?
- According to her, she had to look for a supplier on the Internet. Then talk to him, meet him... And she should also compare the bottles or caps with those that are already supplied to us. So it took 10 hours to find a supplier, and another six hours to compare products.
- When an employee “sells” a task to a manager, should he explain where he spent his time, why he decided to do this, in other words, justify it?
- Yes! And we had such moments, for example, someone would bet as much as 35 hours on a market round.
- What for?
- So we asked the same question: “You are going on a market tour, how many points will you check? Fifty in two days? It will only take you four hours, two a day. And why do you set it to 35 hours?” Of course, then that employee corrected the hours, sat and thought about what other tasks to do in order to invest in these hours.
- What can you say about the assistant’s KPI matrix?
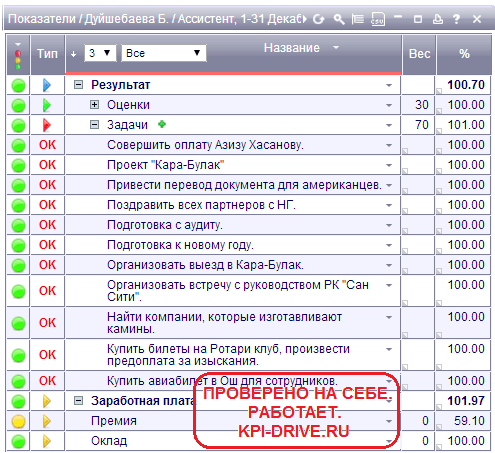
- I admit, nothing interesting (ill. 16). It turns out that when you identify users of a program, you still need to consider the importance of the position and how it benefits the company. An assistant manager is one of those “armchair” people who do not have to be tied to this program. It was possible, of course, to replace this user with another one, for example, the head of the service department; there would be more demand from him. And he can be given tasks that he can solve. Therefore, I can’t say anything special about the assistant matrix. Yes, you yourself read these tasks - “Make payment to Aziz Khasanov”, “Congratulate all partners on the New Year”...
Il. 16. Assistant KPI matrix
An assistant is needed only by the manager personally. And he himself must control her work, she reports verbally, because they see each other every day. And so it is clear that the task “Organize a meeting with management” means calling and telling. For example, the task “Buy tickets to the Rotary Club.” Of course, she will acquire them and pass them on. For those who will implement the KPI-Drive program, I will say right away that you still need to take into account the importance of the position in the company.
- We have one client who has been working with KPI-DRIVE for a long time (), says this: “Even a janitor can influence the performance of a company.” Have you thought about adding some global indicators (for example, profit) to the assistant’s matrix?
- This happened to us later. I have already said that when forming the program, we entered indicators into the matrices simply from the job description. Later, when we were once again trained in KPI technology at the Training and Consulting Center company, we understood the relationship of KPIs both to strategic goals and to individual departments, as well as to the goal and to a specific position. And only then did they begin to understand that, it turns out, any employee in the company - from the janitor to the general director - needs to be tied to goals. And then, based on them, set indicators.
- In other words, one should proceed not from the job description, but from what the company needs?
- Yes Yes! That's when we began to build cross matrices. For example, we have a marketing goal - to achieve such and such a value. What does the receptionist have to do with her specifically? How can it affect marketing, production, technical department? It was when we made such cross-influences on each other that, of course, all our goals came to the surface. What do you have to do for the marketing department to achieve something? After this, they began to understand that the system itself should have been configured this way from the very beginning.
- Please comment on the matrix of the head of the sales department.
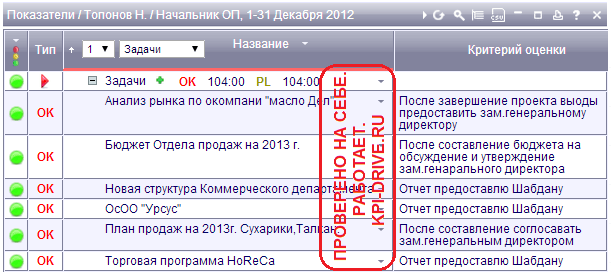
- He has three indicators. The first, with a weight of 15%, is the return of expired products, this happens with us. The second is the receivables turnover rate, which they should not exceed. That's another 10%. The third indicator is the main one, because it is sales. That's why they put more weight - 35%. And the tasks were set at 20%, his main task is to sell (ill. 17). For example, he must also check accounts, the work of sales agents and so on. That’s why they gave it less weight and said that sales still have a greater influence. His other tasks are market analysis, department budget, new structure, etc.

Il. 17. KPI matrix of the head of the sales department
- Are the tasks of the head of the sales department more likely related to the management of the department?
- Yes, he draws up a budget, looks at the sales plan for new products (ill. 18). For example, in 2013 we began producing crackers. Another program is HoReCa. Someone sent a commercial proposal, and he studies the HoReCa market, and presents the report to Shabdan, our deputy general director.
Il. 18. Tasks of the head of the sales department
- Tell me, if his subordinates have low sales, will this affect his results?
- Yes, it will.
- The next one is the matrix of the HR director, here tasks take a lot of weight (ill. 19). Why?
- Our HR director works on personnel policy and corporate culture. And in general, we must set some kind of expanded strategic goal regarding personnel. We thought that these were project things after all. Therefore, in 2012, we deliberately placed a lot of weight on the tasks.

Il. 19. KPI matrix of HR director
Judge for yourself: “Project on discounts for company employees”, “Conducting trainings for sales agents”, “Preparation of the organizational structure for 2013”, “Work plan...”, “Employee training plan...” (ill. 20).

Il. 20. Tasks of the HR director
We have many tasks tied to the training of specialists; training applies to all positions (positions). Imagine how many positions we have, hence the training plan is so large. It must be developed, agreed upon, and approved. All this is a lot of work for HR. You see, before the New Year there were so many tasks: a festive show program, a snowball fight, delivery and distribution of gifts (ill. 21).
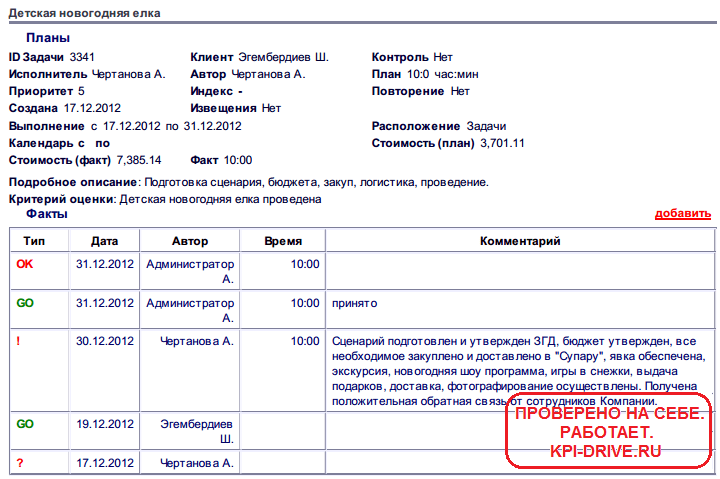
Il. 21. An example of an HR director’s task is to organize a New Year’s tree
- However, let’s return to the indicators of the HR director (ill. 19). Among them is “Percentage of applications closed on time.” Many companies have it. Please comment.
‑ Applications for recruitment are submitted. For each vacancy, we have developed requirements and set deadlines, usually from two weeks to a month. We submit applications for some of the most important positions a month in advance in order to select a more or less suitable candidate who would meet our requirements. Such an application has been received - that’s it, they must close it within two weeks to a month. So we set this indicator. But being on time is one thing, and selection is also carried out based on quality.
The candidate must meet all our requirements. The head of the department who submitted the application must write down exactly which employee he needs. Primary and secondary interviews are conducted...
The second indicator is HR productivity. Now we keep the following statistics for each employee: sales (revenue) are divided by the average number of employees in a given month. There a certain number comes out, and we say that the productivity of one employee is so and so.
- So, this is the average value?
- Yes. But for now it’s just statistics. Perhaps later we will set a certain number. And then we will say that the employee’s productivity, for example, is such and such.
- Please tell us how the matrix of the PR director is set up?
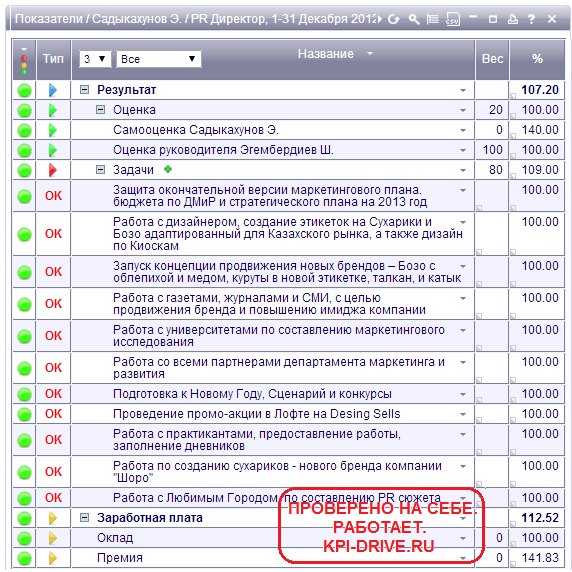
- We had a controversial point: the “sales people” said that its indicators should still be tied to product sales. And at first we set this indicator. But then, when they began to consult outside, and we have our own marketing gurus, we were told that the PR director’s indicators should not be tied to sales. They considered that PR people do not directly make sales (Fig. 22).
Il. 22. KPI matrix of PR director
- However, if you look from the point of view of a manager, is a marketer hired, in essence, to increase sales?
- Yes! This was the first matrix we created for him. Then we changed it and gave him an indicator. I already told you that we sat down and began to look at the strategic goal, then we looked for the goals of the units, the goals of the positions, the goals of the positions. That’s when we came up with an indicator for him! Our sales are divided by territory: the city of Bishkek and the regions. But it was for him that we made it so that his indicator now reads as “Fulfillment of the revenue plan for Kyrgyzstan.”
Yes, we used to assign him a lot of tasks. And then we set the deadlines for a month, for example, but now they set them by weeks. And this is generally good!
- Because it can be easily controlled?
See how the PR director’s task is described in detail: “...first of all, the work begins with drawing up labels...” (ill. 23). This happens, it's normal. Some of us talk a lot, while others say less...

Il. 23. Example of a PR director’s task (1)
- This specialist probably needs to sort everything out in order to do the job well. You see, in his next task he even has a schedule (Fig. 24). Does the marketer also defend his task to the manager?
- You know, all our users, so as not to delay others, are divided by time, each is given 15 minutes. Everyone, starting with the deputy general director, comes in one by one and “sells” their task. Everything they have and what they will be doing next week. The manager immediately evaluates you and says that you are great, good or bad. 15 minutes - no more!
Il. 24. Example of a PR director’s task (2)
- And here is a very detailed assessment (ill. 25).
- This is the same PR manager who talks a lot. He took up our time. We constantly reminded him: “Time, time, time, it’s time!” But it happens that he does really good things. Then he gives himself a score of +2.
Il. 25. Self-assessment of the PR director with detailed comments and assessment of the manager
- Do you often have controversial issues with your manager?
- At the rate? No!
- What about tasks?
- It’s just that there are a lot of controversial issues regarding tasks. For example, if it is not very important, then why did you set so many hours? Most of the discussions revolve around time.
- Was there a case when someone was given -2?
- No one has ever been given such a bad assessment, but one employee was once given — 1. Firstly, the reporting was not submitted on time. Secondly, the tasks were not “sold” on time. And thirdly, there were too many hours spent on departmental work. In short, it was definitely -1. Of course, this employee was indignant: “Why is that? If this happened for the first time, then don’t immediately put -1.” And this assessment, of course, affected the salary.
- How did such an assessment affect the employee?
- The commentary was very well written, everything was very clear. Of course, there is indignation at the beginning... Naturally, employees immediately ask the manager a question or call me, the project leader: “Gulmira Sambekovna, why did they put me like that, I’m going through some kind of decline.” Of course, I understand that the program is new, that people must get used to it, that there is no need to create a negative attitude towards it in order for this system to truly heal. That’s why I try to explain: “It happened this way because you need to read the document carefully. Besides, you can always call the deputy general director and ask him why this happened.” All this is a normal human factor, without it there is no way.
- Are there also two indicators in the KPI matrix of the head of a motor vehicle fleet?
- Yes, their weight is 20% and 30%. The first indicator is breakdowns along the route. They are recorded, and then the logistician submits the data to the quality department. And the second indicator is the provision of transport. To avoid problems with transportation, each day is counted as one point. Claims mainly come from internal customers. It is they, the sales and remote control departments, who evaluate this very second indicator (Fig. 26).

Il. 26. KPI matrix for the head of a motor vehicle fleet
- Are the sales department employees the internal client of the head of the vehicle fleet?
- Yes, so they record an uninterrupted, one hundred percent supply of transport. Thus, the main indicator for the head of a motor vehicle fleet is the provision of transport. He never let us down in this regard, because he set things up well, and the logistics scheme really works.
Regarding the first indicator related to car breakdowns on the route, I can say that there were problems with maintenance and repairs, they did not have time to meet the schedule. Therefore, the head of the vehicle fleet also had the problem that he did not always get 100% for this particular indicator.
- After implementation, did employees’ salaries in general increase, decrease, or remain at the same level?
- Before the implementation, we received as much as we should have. And here, if there is overfulfillment, then employees even manually calculate how much they will receive at the end of the month. They already have an interest: they can earn more than they should. On average, payroll has increased slightly. Now I can’t say exactly how much we actually counted at the end of the year. But it was not a very large amount.
- That is, there was a slight increase in payroll with a noticeable increase in productivity?
‑ Yes! By the way, about performance. Our HR specialists are now collecting fresh statistical data, and I can say that our performance is generally good.
- Many managers face difficulties in implementing KPI motivation. I know that you did not have any serious obstacles. However, tell us what problems you encountered and what you did?
- There were no particular difficulties in the first month after the introduction of the system. True, there were some technical issues, something like this: “How should I enter a task? How should I set my watch? For some reason I put the data in the wrong place, can you fix it? Where is it?". Yes, that happened. But I can’t say that we had any difficulties. By the way, Technical support was very good.
- Thank you!
‑ I think if you sit and think carefully, you can find everything in the program. But I definitely called Technical Support, and they described step-by-step actions in detail. They probably thought: “The project manager is such a girl that she won’t understand...”. But it’s even good that Technical Support explained everything in detail: you follow the instructions and only remember more.
In addition, I sometimes had to spend hours explaining the features of the program to some employees. People are different. One understands quickly, and the other takes a long time. And here’s what’s interesting: when you explain, he seems to nod his head, but went to his place, did something wrong again, calls me again and says: “Explain again.”
Although the staff was trained locally, I personally sat with each one and explained how to enter all this data. Each user had to be dealt with separately. Because that's what I was initially tasked with doing. But this was also new for me! I took out the notes, we looked through them together, talked with the employees. Then I developed entire procedures: first, data entry, who should enter it into the program and how, then daily reporting. All these formulas were a little difficult to enter. But there haven’t been any major difficulties yet.
By the way, there was another moment. People began to go on vacation, and they had 100 hours left. Then they said: “Sorry, I’ve been working 168 hours for a month...”. The fact is that in our country people go on working leave for 14 days. Have you thought about what to do if a person does not complete 100 hours of tasks within a month? If he goes on vacation for 15 days, how should this be formalized? Like, “I will do 100 hours in 15 days, and you will cover me in full, but in terms of payment, that is, in terms of working time, it will be less.” In general, Technical Support helped us again. They said: “Set productivity at 50% for the time when a person goes on vacation. That’s what everyone does.” But, again, there were no serious problems.
- The most interesting question is about the results (Table 3-4). What achievements do you have in managing goals and objectives?
- We initially understood that the key indicator was efficiency. This then helped us realize that we need to set ourselves strategic goals first! And in order to achieve them, each department must set certain goals for itself. So, we have defined a strategic goal. Then we created a goal in each area, for example, we had HR, financial, marketing, and production goals. And, based on them, we determined the final goals for the divisions. After this, it becomes clear what specific goal the head of each department should set for himself. At the same time, the purpose of each position becomes immediately clear!
We made crossover points, we even have a table with the same name, which we needed in order to achieve our marketing goal. And also to come to an understanding of how the latter relates to the production goal. Naturally, we also identified key success factors. Then the company’s goals were able to be adjusted (Table 3).
______________________________________
| Results in goal management (KPI) and objectives |
|
______________________________________
Table 3. Results in managing goals and objectives
I have already spoken about the tasks that you set for yourself and then “sell” them once a week. The fact that task completion is monitored, and this greatly disciplines employees, always keeps them on their toes, too. If the manager sees that a subordinate manages to complete this task or does not meet the deadline, then he can immediately determine where the employee is good and where he is not so good. The manager is such a loyal person that he will never say that this employee is bad. As a rule, he says: “This is not a very good employee.” And, as I already said, with the help of the KPI-Drive program we learned to determine the rating of tasks, highlight important and current ones among them, began to record our hours (and this is time management) and know exactly what you will have time to accomplish during this time .
At the very beginning, when we set tasks for a month, this time was blurred. An employee could walk, for example, for half a month and not do this task. At the same time, he knew that in the last two or three days he would accomplish everything. This, of course, was not good. But when they began to set implementation tasks, then self-discipline really improved. Additional intangible motivation kicked in.
- What can you say about the results in standards management?
- Initially, during training, we were immediately divided into standards and tasks, although before that people thought that all of these were the same thing. Then we began to say that standards are internal rules. And we divided all our procedures within the company.
I have already talked about internal audit. We have seven people working in this area. They analyze all business processes. It also happens to us that this or that procedure becomes irrelevant because we have selected an employee who expands the field of activity.
And vice versa: a moment comes when employees suddenly refuse to follow all the algorithms of a particular procedure. Then we write protocols, corrective instructions, etc. And then this business process is re-checked.
On the issue of self-esteem. Employees began to evaluate themselves objectively. Cross-evaluations are made by the company's internal clients. For example, heads of sales departments, including regional ones, evaluate the head of the vehicle fleet (Table 4).
______________________________________
______________________________________
Table 4. Results in managing standards (assessments)
- Tell us that you read your grades out loud. How does this affect colleagues?
- We have such emotional moments. For example, when a manager gives an assessment and says: “What a great fellow you are for doing this. Thank you for your work!” It seems to me that such words are sometimes more important for our employees than material bonuses. At such moments you want to do even more and better. This is great motivation!
Good words are very important to employees. Moreover, all this creates some kind of corporate spirit, a certain complicity arises, you understand that in this company you are worth something. This is also a very important result. And also a call to heroism...
- Very interesting! What results have been achieved in managing payment and material motivation?
- I can only repeat: employees began to say that “now we can earn more and get what we deserve.” In fact, you have certain indicators, you set goals for yourself and “sold” them to the manager. Naturally, you will also receive a higher salary. Agree, this is a good motivation when you tell everyone that you can earn more and give the example of the best employee, say, the chief engineer: “She has this salary, salary plus bonuses, but this month she received this much. Both you and I can earn more too.”
Regarding the wage fund, I also want to repeat that it, of course, has grown, but I believe that it still has not increased so much compared to how the productivity and efficiency of employees has increased.
- How did you feel about it? How did this increase in labor productivity manifest itself?
- Employees have clarity and clarity of thinking when they know exactly what their indicator is, and by fulfilling it, they will achieve a certain goal. Therefore, the tasks that employees set for you are completed on time and with high quality. And all this is controlled and verified. And the person also knows that they are satisfied with his work. So control also improves productivity.
Accurate statistics during the month of all tasks, numbers, words and amounts greatly increases productivity. For example, even at home I began to set tasks for my children: “During this time, you must do this. How are you going to accomplish this? Go ahead and plan!
- Do you think it is possible to organize such KPI management without a program? How realistic is this?
- Probably real. You know, now in Kyrgyzstan KPI management has become very popular. There are a lot of trainings. By the way, two large mobile operators have begun to implement KPI management. What did I see in one of these companies? They have a complex table. There are not many positions, but for some reason they made the matrix very difficult. Of course, I didn't like this a little.
It’s fortunate that we have such an automated program; everything in it is simple and clear. And it happens that people write all this manually, put it into a table, set goals, and write down business processes. It’s really difficult for those who don’t have KPI management. We were just lucky, our business processes were already written down, we took the KPI-Drive system and applied it to them.
Perhaps there are other companies that will choose, for example, not the technology of Alexander Lityagin, maybe they have some other technique. But there are now a lot of trainings being conducted among businessmen, and I believe that business leaders will be interested in the KPI-Drive program. I note that I was also invited to conduct training with “sales people.” They immediately asked that it be practical, that I tell the story of the implementation of KPI motivation in our company.
-Are they interested in the idea of KPI management?
- Yes! But then I was not quite ready yet. As a project leader, I already knew and felt that the KPI system is built precisely from goals. And only after what we have done to date in our company, when everything has become clear and clear, can I now safely tell others about it. And then I doubted and refused to conduct trainings, answering: “I’m a little damp in this regard.” And now, of course, I have already realized that we need to start with defining the company’s goals.
Tell us what mistakes you made during implementation? And what advice can you give to those who are just starting to implement a management system by objectives?
‑ I want to show everyone who will implement the KPI-Drive program the mistakes that we have made so far. Let them not be repeated and do not waste unnecessary time.
The first mistake: we did not immediately identify the key factors and goals of the company.
The second mistake: we did not explain to employees how to achieve their goals, so the first indicators were a little vague. I have already talked about how we first established some indicators, then changed them. And all this affects the performance of employees. They think: “Am I doing it right or wrong?” KPI indicators should not be taken from job descriptions, as we initially did, but based on the company’s goals!
Perhaps many will ask the question: “How to set company goals?” There are many techniques, in fact, it is simple and easy.
And I’ll tell you right away by the hour. Remember, I already said that we gave everyone the same 100 hours? Don't do that! It is necessary to take into account the specifics of each position and work out the purpose of the position itself. See if it makes sense for the enterprise at all?
And you need to determine the project leader, taking into account his position in the company. Still, he must have such a position that he can influence other employees. He is required to know all business processes in the company and, naturally, influence decision making (Table 5).
______________________________________
| Mistakes during implementation and recommendations to colleagues |
|
______________________________________
- Let me add: for there to be success, the director must also support this program. Without this, there is simply nowhere. Do you agree with this thesis?
- I just had difficulties implementing a quality management system, because the management did not really understand its essence. They told me: “Let’s do without this.” I had to spend many years explaining: if management does not understand such things, why this system is needed, then this is very bad. Therefore, it is desirable that the CEO, senior management, and shareholders of the company understand the importance of each system, including KPI-Drive.
- If you were creating your own company, would you implement KPI management from the very beginning?
- Yes! I really liked this system. I will say this: if I, for example, had my own company, I would immediately take this automated program. Why? It turns out that it is easier to manage in it, to constantly keep your finger on the pulse of events, even when you are somewhere on a business trip. You can see all the tasks, track how they are completed, who is performing well, who is not doing well...
- And now you have the KPI-Drive program only in the office, is it not on the Internet? Can employees only enter data at work?
- We were just thinking about this topic. We probably need to switch to the Internet now. But we haven’t “matured” yet. We are glad that we have this program and it works!
And if you create a company with approximately 50 employees, then it seems to me that the KPI-Drive program will monitor and manage all business processes in general. I know for sure that this program will work for you! And you will have more time for strategic development.
- Mira, thank you very much for your time. I wish you determination and easy achievement of goals with the help of KPI management. I think that your story was very useful to our readers.
‑ Thank you, Marina, and all the best to you too!
Interviewed by Marina Vetvinskaya.
- What KPIs can be set for engineers working with databases and documentation?
- How to evaluate the effectiveness of employees working in similar positions and receiving the same salary, but performing different functions
- What are the performance indicators for a site manager?
System KPIfor engineers has been working in our company since 2008. Plans are updated monthly; indicators may change from time to time. Employees are familiarized in advance with the tasks that they will have to complete in the next period, so everyone understands how much, for what and when they will receive extra salary. We set no more than five or six tasks per month. The fulfillment of indicators is assessed and signed by two people: the immediate supervisor and the General Director of the division company. We do this after completing the task.
If the process is long (for example, designing an object), then we evaluate the key points passed during the reporting period. For example, if the KPI indicator for engineers is called “Calculating volumes according to design documentation for tenders, concluding contracts,” then this means that the employee had to calculate how much concrete, piles, bricks and glass are needed to build a facility with an area of 20,000 square meters . m. After this, the employee announces a tender for contractors and suppliers, where he selects companies that can perform contract work on favorable terms and signs contracts.
In table 1–3 show KPIs for engineers, by which we assessed the effectiveness of employees of various specializations in November.
The planned value in rubles is an absolute value. In case of non-fulfillment or partial fulfillment of indicators, the coefficient is reduced. For example, an employee missed the volume when calculating the estimate. The result will be a lack of funding from the customer, since he does not see the need for this work in the estimate. The manager can punish the employee by setting the performance coefficient in such a situation not at 0.3, but at 0.2. Accordingly, the employee will receive less compensation than planned.
KPI for an engineer in the production and technical department (specialization - working with contractors)
| Index | Indicator weight | Planned value (rub.) |
| Drawing up acts for hidden work on object N, preparing execution documentation and completing it | 0,2 | 6 000 |
| Drawing up information tables to track the amount of work | 0,2 | 6 000 |
| Coordination and signing of execution documentation with the customer | 0,2 | 6 000 |
| Calculation of volumes for object N, preparation of summary statements for the estimate department (KS-2, KS-3) | 0,2 | 6 000 |
| Interaction with related departments, customers, designers | 0,1 | 3 000 |
| Performance discipline | 0,1 | 3 000 |
| Total | 1 | 30 000 |
KPI for engineer on initial permitting documentation
| Index | Indicator weight | Planned value (rub.) |
| Obtaining justification for wastewater discharge points, preparing materials for obtaining Rospotrebnadzor's conclusion on discharge points, permission to discharge treated and storm water into the river X | 0,3 | 9 000 |
| Preparation of materials for assessing the impact of design decisions on the fishery characteristics of streams, calculation of damage, compensation measures | 0,3 | 9 000 |
| Preparing letters to the supplier of wooden structures Z, resolving current issues regarding delivery, transfers, payment | 0,3 | 9 000 |
| Performance discipline | 0,1 | 3 000 |
| Total | 1 | 30 000 |
Key Performance Indicators for Energy Service of an Industrial Enterprise
A.P. Dzyuba, Executive Director at LLC "Gazenergosbyt", Chelyabinsk
Keywords: energy aspect, key performance indicators, energy service of industrial enterprise, automated metering of energy resources
One of the most relevant tasks for management of any industrial enterprise is reduction of the share of cost of energy resources in the production cost structure of the final product. This task is especially acute for Russian management who have to manage the production efficiency in light of continuous growth of energy tariffs compared to the competitor-countries, as well as national specifics of the energy business in Russia.
Description:
For the management of any industrial enterprise, one of the most pressing tasks is to reduce the share of energy costs in the cost structure of the final product. This task is especially acute for Russian management, which has to manage production efficiency in the context of a constant increase in energy tariffs, high volumes of energy consumption compared to competing countries, as well as the national characteristics of the Russian energy business.
Key performance indicators for the energy service of an industrial enterprise
A. P. Dzyuba, Executive Director of Gazenergosbyt LLC, Chelyabinsk
For the management of any industrial enterprise, one of the most pressing tasks is to reduce the share of energy costs in the cost structure of the final product. This task is especially acute for Russian management, which has to manage production efficiency in the context of a constant increase in energy tariffs, high volumes of energy consumption compared to competing countries, as well as the national characteristics of the Russian energy business.
The main feature of managing the energy complex of an industrial enterprise is that possible reserves or excess energy costs are not obvious to the top management of enterprises. In addition, the energy management system of Russian industrial enterprises has the foundations laid by the planned economy of the USSR, where the main task and function of energy services was to ensure reliability, continuity and quality of energy supply. Soviet industry did not reduce the cost of energy resources primarily for two reasons: firstly, energy was cheap, and secondly, there was no possibility of influencing the cost of energy due to strictly fixed tariff rates.
However, at present, the specifics of the country’s energy business have undergone profound fundamental changes associated with the emergence of the following mechanisms:
- creation of energy markets and exchanges for trading energy resources, as well as the development of competition among energy suppliers;
- the emergence of energy market mechanisms that allow, through a strategy of one’s own behavior, to manage the cost of consumed energy resources;
- development of automation and control tools that allow accounting, control and planning of energy consumption parameters;
- the emergence of energy service companies as a type of business, the development of mechanisms for energy service contracts.
The practice of working with Russian industrial enterprises allows us to identify colossal underutilized potential for reducing energy costs, which makes investments in the energy sector of enterprises very popular. For example, the use of individual energy market strategies makes it possible to achieve a reduction of up to 40% in the cost of purchased electricity, which can reach several billion rubles in annual terms, without reducing the volume of electricity consumption and damaging the production program. Thus, in the management systems of industrial enterprises, one of the basic elements of management key performance indicators (KPIs) should be the energy aspect.
Formation of a KPI system for the energy service of an enterprise
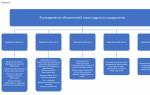
A large share of the main tasks facing the energy service of an industrial enterprise are tasks classified as economic (Fig., blue), which appeared in the process of development of the energy business in Russia. A minority of the tasks are technological (Fig., yellow) aimed at increasing the reliability of energy supply.
Traditionally, the main difficulty in creating a KPI system is the development of indicators aimed at increasing operational efficiency.
For energy services of industrial enterprises, an obvious indicator is the extent to which energy costs can be reduced while ensuring the reliability of energy supply. However, taking into account the fact that energy consumption costs can be divided into many components: types of energy resources, cost structure (cost associated with volume or price), energy consumption objects, period of energy consumption, seasonality, production program - the task of accurately setting KPIs is non-trivial and requires individual approach for each enterprise.
KPI indicators and their classification
We offer some KPI indicators for energy services of industrial enterprises (Table 1), which are based on existing tasks. These indicators have a fairly wide range of coverage of the activities of energy services, so they can be used at any type of industrial enterprises.
| Table 1 Some KPI indicators for energy services of industrial enterprises |
||||||||||||||||||
|
||||||||||||||||||
* Possible dimension of assessment |
Also, the proposed KPI indicators can be classified according to the types of their accounting (Table 2). The proposed classification makes it possible to expand the scope of application of KPI indicators, to combine and adapt them to the specifics of various types of industrial enterprises, which generally makes them universal.
| table 2 Classification of KPIs by accounting type |
||||||||||||||||||
|
The proposed information about KPI indicators and their classification by type of accounting is not exhaustive and can be supplemented or combined depending on the focus of the enterprises’ activities and the specifics of the tasks performed within the competence of energy services.
Assessing the efficiency of the energy service
When assessing the performance of an energy service, it is necessary to take into account the influence of the following factors:
- seasonality;
- production intensity;
- nomenclature and range of production;
- production shift;
- technological process mode;
- type of raw material;
- type of production equipment.
Taking these factors into account will make it possible to eliminate as much as possible errors in measuring KPI characteristics over time and improve the quality of management.
Before developing and implementing a system of KPI indicators for energy services, enterprise managers should pay attention to ensuring the organization of accurate planning, accounting and control of energy resources.
Automated energy metering
Most types of energy resources can be automated online (electricity, heat, gas, water). To organize accounting functions, you can use an automated system for technical accounting of energy consumption (ASTUE), which is available at every industrial enterprise. ASTUE allows, with a given measurement discreteness, to perform remote metering, transmission and storage of data on energy consumption parameters. However, to expand the number of control objects, an increase in the number of metering devices will be required, which requires additional costs.
Also, data from factory ASTUE systems can be automatically integrated with ERP systems existing at enterprises, which will improve the quality of processes for organizing, planning and monitoring KPI indicators, as well as the efficiency of enterprise management as a whole.
Assessing the efficiency of energy services and planning work through the KPI tool allows you to reduce energy costs and increase the efficiency and sustainability of the enterprise as a whole. The proposed system of KPI indicators for energy services is distinguished by its universal application at all types of industrial enterprises, the ability to combine the proposed indicators, and its high efficiency.
Subjective assessment
Our company creates intangible things - complex technologies and solutions in the field of artificial intelligence. 70-80% of our expenses are the salaries of highly qualified programmers, engineers, linguists, and managers. And, of course, we want these people to work as efficiently as possible. Hence the task of creating a system for regular evaluation of their work arises. And building such a thing is very difficult, especially for engineers. Firstly, their work is divided not into quarterly periods, but into different periods of time for tasks. Secondly, there is a lot of subjective stuff here. But we decided that this would not stop us.
The company's best experts identified about 18 important parameters: deadlines for assigned tasks, achieving quality levels, code maintainability, ability to explain one's point of view, etc. We determined their weight and built a 100-point scale, where each of the criteria corresponded to a portion of points. Specialists were appointed to assess achievements and shortcomings according to KPIs. Everything is ready, you need to try to implement it.
After about six months, I asked HR: “How are things going?” They explained to me that nothing worked. Why? Firstly, it was difficult, the system turned out to be cumbersome and required the participation of different people and control. But the main problem was different. When you do something first, when you do artificial intelligence, all the tasks are unique. No one has done this work before you. Therefore, when setting a task for an engineer, there is only a subjective assessment of the expert about its complexity and deadlines.
Now imagine the assessment of at least two employees. One has 78 points, the other has 62. The employee with lower scores is called by the manager and draws attention to the low scores - “you’re letting us down, we need to do something about it.” And he hears an answer something like this: “Some expert decided that this work can be done in three months. And I did it in four, for which I received some fines. But anyone else would have done this job in five months. Your expert is wrong, I accomplished a feat of labor.”
It's not easy to object. By and large, the engineer is quite possibly right. You can check for sure only by entrusting the same work to another engineer and measuring his time costs. But then the control function will cost more than the production function. But this was not part of our plans and looked completely stupid from an efficiency point of view. So what should we do?
We're back to square one. Why were these assessments and KPIs needed at all? Initially, we simply wanted to praise those who work hard or encourage those who are lazy, so that people would be motivated to work well when praised, and better when scolded. But our entire resulting rating system did not really contribute to this: the feedback was distorted due to the subjective nature of the ratings.
When we realized this, we froze. But then a simple thought came to mind. Each of you can remember a time when he worked from dawn to dusk, performed feats of labor, overcame obstacles, did not complain, but simply worked phenomenally quickly and a lot. When did this happen? When you really liked the work, you were passionate about it. At such moments, a person motivates himself and copes with tasks as well and efficiently as possible.
What motivates people?
To make your company's employees work harder and better, you need to make their work interesting. This became our goal. We partially retained the KPI system, but in a simplified form, discarding heavy constructions with various formal assessments, and began to invest more in creating “interesting things”.
ABBYY develops unique technologies, and we have always hired talented people to work for the company. We employ engineers of such a level that they must be occupied with non-standard and very complex tasks; this is what motivates them. These people cannot be used to produce, say, databases: they will get bored and run away. But often people carrying out their local task do not see the full scale of these developments and the final result. And the first thing we did was to systematically tell employees about the main goals that we are all moving towards together, about large-scale projects being implemented all over the world based on the technologies that they create. We organized regular open meetings between the heads of the company and employees. From the reactions of our colleagues, we realized how important it is for bosses to be able to explain to employees why what they do is important. When a person feels involved, when he sees his role in something big, work turns into an interesting game, the person gets carried away. Everything falls into place, he creates for his own pleasure.
We also understood that a person's engagement directly depends on his belief in the company and its leaders. But this faith cannot be achieved unless you gather a team of like-minded people who share the company’s values. In our case, these are people who think innovatively, one step ahead, high-quality results are important to them, and they are able and willing to learn independently. Therefore, in addition to working with the current team, we began to actively look for the same “abish” people. This became the second task.
An “Abbish” person does not work alone, and the main value embedded in ABBYY is a team approach. And our third task is to make sure that current and new employees enjoy working in a team, so that they are not afraid to express their opinion to their manager, colleagues, and discuss it. We form this approach to work through the creation of special conditions and corporate culture, no matter how trivial it may sound.
People don't come to work to fit the tables. They don't like being looked at under a microscope. And the formal rating system for a certain type of activity, especially creative, unique ones, plays not a positive, but a negative role. People stop working when they lose interest. Without this foundation, all performance assessments will only hinder your work and will not improve productivity in any way.
From this article you will learn:
- What is KPI
- What examples of KPIs for representatives of various specialties can be taken into account?
- How to calculate KPI in EXCEL using an example
The method of personnel assessment using key performance indicators KPI (Key Performance Indicator) is based on the methodology of “management by objectives” by Peter Drucker. In Russia it has been used since the early 2000s. In this article we will describe the essence of KPI, give examples of KPI and show the prospects for applying and improving the KPI method at Russian enterprises.
What is KPI with examples
Since July 1, 2016, Russian enterprises have been introducing professional standards as the basis for developing personnel policies. To assess the success of meeting standards, a system for assessing the quality of workers' work is needed.
The criteria that characterize the quality of work are presented in Figure 1.
Picture 1. Structure of labor quality criteria for enterprise employees.
Level I criteria- these are actually the names of the two main classes of criteria.
Level II criteria– generalizations suitable for submission for an award (but not for evaluation).
Level III criteria– unified indicators that allow for an approximate assessment of the effectiveness and reliability of an employee’s work. Almost all known methods of personnel assessment are focused on assessing level III criteria. Depending on the education and literacy of the authors of the methods and consumers, the most often chosen are:
- Purely economic KPI criteria. Applicable to managers and specialists directly involved in financial management and product sales.
- Questionnaires in the form of forms for experts to assess competencies.
- Psychological criteria (Cattell test, etc.) - on the assumption that the quality of work is determined primarily by personal characteristics.
- Job profiles based on specialized (mainly psychological) sets of indicators.
Let's consider the most popular assessment technology based on KPIs.
Main idea of KPI– detailing the strategic goals of the enterprise down to the employee level. As a rule, financial and economic indicators act as strategic goals. There are several subgroups of KPIs based on quantitative measures of activity:
- Expenses– in value terms.
- Performance– percentage of equipment load.
- Efficiency. Most often this is the ratio of revenue to cost.
- Results. For example, the number of products produced.
Key performance indicators can be operational or strategic.
- Operational indicators characterize the current performance results of the enterprise and its divisions. They allow you to quickly monitor technological processes, material support, product quality and adjust control parameters in accordance with changing conditions.
- Strategic indicators allow you to monitor the generalized results of the enterprise for a month, quarter, half year and make decisions to ensure that these results comply with the planned ones. Short-term forecasts of the efficiency of departments and profitability for the coming period are calculated.
KPI are numerical indicators of the degree of success in achieving specific goals. This allows you to use the KPI system as the basis for motivating management of employee activities.
Examples of KPIs for representatives of various specialties
KPIs are most convenient for assessing the labor efficiency of administrative and managerial personnel (managers, economists, financiers, etc.).
Key performance indicators of trading activities are calculated based on the following data:

Key production performance indicators are calculated based on:
Specific examples are presented in the following table:
| Job title | Index | Estimated value, % |
| Head of marketing department | Sales plan completion percentage | 100, where Q f – actual sales volume, Q pl – planned sales volume |
| Marketer | Product market share | Data from external marketing agencies |
| Chief Accountant | Timely filing of tax returns | Federal Tax Service information |
| Accountant | Timeliness of payments (as a percentage of the total) | 100, where Op cp is the number of payment transactions completed on time; Op total – total number of payment transactions |
| Head of Legal Department | Percentage of cases won (out of total number of cases) | 100, where Q in is the number of cases won, Q total is the total number of cases |
| Lawyer | The amount of money that is collected and retained for the company | Data from the legal department (as a percentage of the plan) |
Example of KPI calculation in EXCEL
Each enterprise develops its own KPI assessment system. Key performance indicators are established for each position independently. Their total number for a specific position/workplace is no more than five. At the end of each month (for some enterprises - a quarter), the final individual KPIs of each employee are calculated as a weighted average of private KPIs. The simplest algorithm for combining private indicators of an individual workplace: 
where are private performance indicators;
n –
number of private indicators ( n≤5)
;
– weights of individual (private) KPIs. Usually
The weights vary because the significance (importance) of individual indicators may not be comparable. Weights are normalized: ![]()
Formulas for calculating bonuses based on values K(decision rules) can be expressed as a simple linear or step function TO.
The values of motivational coefficients (that is, conversion factors K bonus) can be determined, for example, according to the following algorithm:
The following figure shows a clear example of calculations using Excel. 
Figure 2. An example of assessing the success of an activity.
Explanations:
- Salary– fixed part of the salary. It is proportional to the number of hours worked. To simplify the calculation example, the fixed and variable parts of the salary are assumed to be equal.
- Percent fulfillment of the sales plan and work plan is calculated based on the ratio of actual indicators to planned ones (as in the above table of calculated values).
Formulas in Excel for calculating KPI for each employee: =(50% × (IF(D3<80 %; 0; ЕСЛИ(D3<90 %; 0,5; ЕСЛИ (D3<100 %; 1; 1,5))))). Влияние показателя 1 и показателя 2 на сумму премиальных считается одинаковым. Коэффициенты тоже равны. В связи с этим для расчета показателей 1 и 2 берутся одни и те же формулы.
- The formula for calculating the amount of premium to accrue is =C3 × (F3+G3). The planned bonus is multiplied by the sum of indicator 1 and indicator 2 for each employee.
- Salary – salary + bonus.
In order to evaluate the work of employees according to several key performance indicators, a matrix of the following form is compiled: 
Figure 3. Worksheet form.
- Key indicators A – private KPIs (.
- Weights B – .
- Base C is the minimum value of the indicator.
- Norm D – planned level.
- Goal E is the value to strive for. Excessive indicator.
- Fact F – actual results of work.
- KPI G index – level of result in relation to the norm.
Formula for calculating the KPI index: 
An example of filling out a matrix for an office manager is shown in the following figure. 
Figure 4. Example of KPI calculation.
The performance coefficient is the result of calculation using formula (1).
How to implement a KPI system in an organization
As can be seen from the above example, the implementation of a system of motivating personnel management based on key performance indicators does not require serious investments and highly qualified developers. No special training is required for HR specialists - the ideology is simple and popular. There are many enterprises that operate semi-automated Excel-based systems. The whole question is how effective personnel management is when using the technology discussed.
As can be concluded from the example, the KPI system is best suited for enterprises with discrete production, for example, mechanical engineering enterprises. For industries with a continuous process (for example, nuclear power plants, chemical plants), the main attention should be paid to the technological component of control, its reliability and safety. In this case, for example, it is impossible for an occupational safety inspector to formulate appropriate assessment criteria related to the financial well-being of the enterprise.
To correct this shortcoming, you can supplement the KPI assessment complex with a competency assessment subsystem. An example of a fairly successful solution is the STP 001.089.010-2005 standard, developed at OAO Irkutskenergo.
At OAO Irkutskenergo, special forms are used to assess competencies, which are filled out by experts - the head of the person being assessed and his colleagues. A sample of such a form is presented in Table 1.
Table 1. Employee competency assessment.
| Criteria for evaluation (competencies) |
Grade | Average competency score | ||
| Supervisor | Colleagues (average score) | Self-esteem | ||
| Initiative(willingness and ability to solve professional problems and issues, caring attitude towards work situations, desire to actively participate in work, influence the results of activities) | ||||
| (ability to set priorities, stick to a task plan) | ||||
| Knowledge of work(professional literacy, practical knowledge and skills, understanding of the content of the work, knowledge of methods, procedures, rules) | ||||
| Responsibility(timeliness, integrity and quality of task completion) | ||||
| Communications with the manager(informing the manager about the degree of completion of work assignments, consultation with the manager on work performance standards) | ||||
| Communications with colleagues(effectiveness of teamwork) | ||||
| Discipline(attitude to working time, its use, adherence to working hours) | X | |||
| Average score for competencies (Ok) | X | X | ||
Experts assess the employee’s compliance with the job requirements using points. In this case, competency dictionary scales are used. Examples of scaling of two competencies are presented in Table 2.
Table 2. Scaling competencies.
Initiative
| Point | Characteristic |
| 1 | Does not show personal initiative when solving production issues |
| 2 | Very rarely makes constructive proposals |
| 3 | Often makes proposals that are rarely implemented in practice |
| 4 | When solving production issues, he constantly makes constructive proposals within the framework of his job responsibilities and brings them to practical implementation. |
| 5 | When solving production issues, he constantly makes constructive proposals not only within the framework of job responsibilities, but also concerning the work of the department as a whole. Brings proposals to practical implementation |
Ability to plan work effectively
| Point | Characteristic |
| 1 | Unable to plan even the simplest work or determine time costs. Doesn't know how to identify stages of work |
| 2 | Copes poorly with planning and does not attach importance to the costs of completing a task. Does not know how to break down a task into work stages and set priority for completion. Plans are mostly unviable |
| 3 | Doesn't handle planning very well. Makes mistakes when determining costs, priorities, and methods of achievement. Plans very often turn out to be unviable |
| 4 | In general, he copes with planning; when drawing up plans, he takes into account the costs of achieving his goals. Typically, all assigned tasks are aimed at achieving the overall goal of the activity. |
| 5 | Well determines the costs of implementing the plan. The goal is divided into stages of achievement. Correctly sets priorities at all stages of plan implementation. Always strives for viability and realism of the plan |