“The Law of Demand: Theory and Practice. Supply and demand Taxes and subsidies
Introduction
2. Types of demand
3. Factors of demand change
4. Aggregate demand
5. Elasticity of demand
Conclusion
Bibliography
Introduction
In market conditions, the center of economic activity moves to the main link of the entire economy - the enterprise. It is at this level that all products necessary for society are created and various services are provided. The enterprise resolves issues of economical use of resources, use of high-performance equipment and technology. Here they strive to reduce production and sales costs to a minimum. All this requires deep economic knowledge. Indeed, in a market economy, only those who most competently and competently determine the market requirements, create and organize the production of products that are in demand, and provide high incomes for highly qualified workers will survive.
The relevance of the topic lies in the fact that studying market demand today is becoming a priority task in the functioning of an enterprise. Constant monitoring of demand and the ability to instantly respond to the slightest changes (that is, production flexibility) - all this predetermines the survival and successful operation of the enterprise. Currently, for any company, it is more important not even to produce any product, but to sell it, to find a specific niche in the market for its product. That is why numerous marketing departments that are directly involved in sales and sales of products, who know what demand is and how it changes over time, are now taking the lead.
The purpose of the essay is to study demand and the law of demand.
Based on the goal, the tasks of this work are formed:
1) define demand, analyze its curve;
2) explain the formulation of the law of demand;
3) list the types of demand and factors influencing its changes;
4) conduct an analysis of aggregate demand;
5) define the concept of elasticity of demand.
1. Demand and its curve. Law of Demand
Demand is the quantity of goods that the buyer wants and can buy over a certain period of time (effective need). The volume of demand, or demand, must be distinguished from the volume of purchases. The volume of demand is determined only by the behavior of buyers; the volume of purchases is determined by both buyers and sellers.
The essence of the law of demand is the inverse relationship between the price of a product and the demand for it, other things being equal, that is, the demand for a product increases when its price falls, and, conversely, the demand for a product decreases when its price rises. The reasons for the existence of feedback between price and demand are as follows:
The lower the price, the greater the propensity of people who previously bought this product to buy more of it;
A lower price allows people who previously could not afford a purchase to purchase this product;
A low price for a product encourages buyers to reduce their consumption of more expensive substitute products.
The first two reasons are called the income effect, i.e. a decrease in price increases the purchasing power of the population. The last reason is called the substitution effect. The income effect and the substitution effect combine to cause the demand for a good to increase when its price decreases. The process of exchange of goods in a competitive market has its own laws. They are found in the peculiarities of the economic response of market participants to the ratio of the quantity of goods exchanged and their prices. Thus, one of the most important laws that “govern” the process of commodity exchange and pricing in a competitive market is the law of demand. Demand is at least a two-pronged concept that relates the quantity of a good purchased to its price. The uniqueness of the law of demand is in the inverse relationship between the price and the quantity of goods purchased: the higher the price, the less quantity of goods will be purchased by consumers. And vice versa, if the price decreases, the number of purchases of this product increases. When the quantity of a given product on the market increases, then, other things being equal, its sale is possible only at a decreasing price. The slightest shortage of goods familiar to buyers in the markets will cause a tendency for their prices to increase.
The law of demand also reveals another important feature: the gradual decrease in consumer demand. This means that a decrease in the number of purchases of a given product occurs not only due to rising prices, but also due to saturation of needs. An increase in purchases of the same product is usually carried out by consumers due to a decrease in its price. However, the beneficial effect of such an increase has a certain limit, as it approaches, even with a downward trend in prices, purchases of goods are reduced. This feature of the law of demand is expressed in the diminishing utility of each additional purchase of the same product. For the buyer, it is becoming increasingly obvious that the beneficial consumer effect from the additional costs of these purchases is decreasing, and the decrease in demand occurs despite the fall in price. Thus, the law of demand describes two important features of the market:
Inverse relationship between price and quantity of goods purchased;
A gradual decrease in demand for any product exchanged on the market.
Demand shows the quantity of a product that consumers are willing and able to buy at a certain price within a certain period of time. This quantitative relationship between a valuable and a purchased product can be presented in the form of a demand scale, i.e. a table that expresses the buyer’s parameters regarding the purchase of goods in a certain period of time.
There is a negative or inverse relationship between price and quantity demanded. Economists called it the law of demand. The essence of the law is that, with all other parameters remaining constant, a decrease in prices leads to a corresponding increase in the quantity of demand and vice versa.
The law of demand is based on two reasons:
1) when the price of a product decreases, it becomes cheaper relative to other products and it becomes relatively profitable to purchase it (substitution effect);
2) when the price decreases, the consumer wants to purchase more goods (income effect).
The law of demand does not apply in three cases:
1) in case of antimonopoly demand caused by an expected increase in prices;
2) for some rare and expensive goods (gold, antiques, etc.), which are a means of investing money;
3) when demand switches to higher quality and more expensive goods (switching demand from margarine to butter).
The price demand function characterizes the change in the quantity demanded from the price of a product:
Q d = f(R). (1)
The characteristic relationships between price and quantity purchased, as well as the tendency for a gradual decrease in demand, can be shown on a graph in the form of a curve called the “demand function” (Fig. 1). On the x-axis is the quantity of goods (Q) or the possible volume of their purchase, and on the y-axis are the prices of these goods (P). The dd curve on the graph is, firstly, a curve with a negative slope, characteristic of an inverse relationship between the variables that determine it, price and quantity of goods purchased. Second, the flat, downward slope of the curve illustrates the gradual decline in demand described above and the declining utility of each additional purchase of the same good. Demand is not a purchase, but its possibility.
Pd0 q A q B q C q D Q
Figure 1. – Demand schedule - dd curve
These characteristic features of demand can be traced using several randomly selected points on the dd curve (A, B, C, D). Any of these points corresponds to a certain value of two variables: price and the number of possible purchases of the product at this price.
Moving from one point to any other, you can only discover the inverse relationship between prices and possible purchases. Point A is a high price and the smallest quantity of a good that can be purchased at that price; point B - the price has decreased slightly, as a result of which the number of purchases of the product has increased, etc. You can imagine the process of moving along the demand curve in the opposite direction: from bottom to top, demonstrating a tendency for prices to increase and the quantity of sales to decrease.
During this movement up or down along the points belonging to the dd curve, demand did not change, and the curve describing it did not move. The ratio of prices and quantities of goods (to which this or that point on the curve corresponds) changed, but these changes did not affect demand. Movement along a demand curve from one point to any other shows how a change in one variable causes an inverse change in another variable. A change in prices only changes the volume of possible purchase and sale of goods, and changing quantities of goods in markets will cause a reverse movement of their prices: a shortage of goods will cause an increase in prices, and the presence of a surplus of goods will cause a downward trend in prices.
To understand the reasons for changes in demand, an analysis of non-price factors affecting commodity markets and the consumer demand function is necessary.
2. Types of demand
Demand is a need presented in the market and backed by money. In this regard, we cannot talk about effective demand, since any demand, by definition, is effective, otherwise it is a need. Demand can also be defined as the desire and ability of a consumer to buy a product at a certain time and place.
Consumer demand is a complex phenomenon consisting of various elements that have certain economic, social, demographic and regional characteristics. This allows demand to be differentiated according to a number of characteristics, which facilitates its regulation.
Table 1. – Classification of demand
Definition of demand
Any entrepreneur, supplying a product to the market, first of all faces the problem of demand for this product. Let's say he intends to invest money in the production of leather bags. But to do this, he must first establish whether there is a demand for bags and what its magnitude is.
Demand is determined by the desire of consumers to purchase a product. But to determine demand in economics, based solely on the desires of buyers is practically impossible and is fraught with serious mistakes. It can be assumed with a high degree of probability that almost all schoolchildren want to have Reebok sneakers, but the manufacturers of these sneakers will make a serious miscalculation if they focus only on the desires of schoolchildren. Everyone understands that today this desire is not feasible for all schoolchildren.
In addition to the desire to have sneakers, you need to have the opportunity to buy them, and for this you need to have about $120 in your wallet. Those who do not have such a sum of money will not be able to fulfill their desire, and for this group of buyers the manufacturers of this goods there is no need to navigate. Hence,
Demand should not be identified with quantity demanded. What does the quantity of demand depend on?
First of all, the quantity demanded will be determined by the price level. Let's say we conducted a survey of a large group of possible buyers, as a result of which we were able to identify the following relationship between the amount of demand and the price of the product, which is presented in table. 3-1.
Table 3-1 shows that an increase in price is accompanied by a decrease in quantity demanded. So, at a price of 10 rubles. per onion of goods, the quantity demanded will be equal to 50 pieces of goods. 1 price increase to 15 rubles. will entail a decrease in the quantity demanded to 42 pieces, etc.
This dependence of the quantity demanded on the price level is called the demand scale. When determining the quantity of demand and its dependence on price, we mean a set time and place. If our study had been conducted in a different country, region, or time, it is possible that each price level would have a different quantity demanded. That's why,
The established relationship between price and quantity of demand can also be depicted in the form of a graph (see Fig. 3-1).
The DD curve obtained on the graph (from the English demand) is called the demand curve. Each point of this curve reflects the dependence of the quantity demanded on the price level. The DD curve was constructed in accordance with the data given in table. 3-1.

The demand curve can be viewed from two perspectives:
For any given price, the quantity demanded shows the maximum quantity of a good that buyers are willing and able to purchase;
For any specific volume of demand, a maximum price is set at which sellers will be able to sell the specified quantity of goods.
Law of Demand
Any competitive market where the process of exchange of goods occurs has its own market laws. They are a characteristic feature of the economic response of the parties to the ratio of the quantity of goods exchanged and their pricing policy. One of the most important laws that are involved in the process of commodity exchange and pricing is the law of demand.
The law of demand is a law in which when prices for a product increase, the quantity demanded decreases, and a decrease in prices leads to an increase in demand for this product. It is safe to say that the law of demand is the link with which the quantity of goods purchased and its price are connected.
That is, the uniqueness of this law lies in the inverse relationship that exists between the price and the quantity of goods purchased. You have probably observed more than once how when the price increases, the quantity of goods purchased by the consumer immediately decreases, and vice versa - if the price of a product decreases, the quantity of goods sold immediately increases, since consumers like to purchase goods in reserve.

There is also a natural tendency that when the quantity of a product on the market increases, it can be sold provided that its price decreases. And you probably noticed that if there is a shortage of goods familiar to the buyer, then the price for them immediately increases, but also, as a consequence, the demand.
But one can also observe another feature of the law of demand, in which consumer demand decreases. Such a decrease in purchases of a particular product occurs not due to high prices, but due to market saturation with this product. As a rule, such a glut occurs because, due to the low price, the population has made many purchases of the same product and the moment has come when such purchases are reduced, although the price for it remains low.
Now we can highlight such important features of the market that the law of demand dictates to us.
The first such feature can be called the inverse relationship that has been established between the price and the quantity of goods that the consumer buys;
The second important feature of the law of demand is such a pattern as a gradual decrease in demand for any product exchanged on the market.
Effects affecting the law of demand
As you and I already know, the demand for a product is not always the same, since its value can be affected by different effects. These can roughly include the following effects:
Firstly, this is the “herd effect” or when the moments of joining the majority are triggered, according to the principle “it will probably come in handy”;
Secondly, this is the Veblen effect or it is also called the effect of conspicuous consumption.
Thirdly, the snob effect also influences demand.
Now let's try to understand in more detail the effects that influence our choice and demand.
The effect of joining the majority
The pattern of this effect is that many people succumb to the herd mentality and buy the product that everyone buys. As a rule, it is dictated by fashion. Every person strives to be in trend, keep up with fashion trends, be on par with others and maintain a common style.
Snob effect
But unlike the previous one, the snob effect is that the consumer tries to stand out from the crowd and purchases a special product that will be different from the majority. He will never buy what seduces the majority. Using this example, we can also say that the choice of a snob buyer depends on the choice of other consumers, but with the only difference that this dependence is inverse.
Veblen effect
Next is the Veblen effect. It got its name thanks to an American economist and sociologist who developed his theory and published it in a book called “The Theory of the Leisure Class.” In his theory, Thorstein Veblen tried to explain the concept of prestigious and conspicuous consumption. That is, in this case, a person acquires a thing not because it is vitally necessary for him, but for the purpose of prestige, in order to impress others and other consumers. With such an acquisition a person wants to emphasize his belonging to a high status.
In this case, such a buyer is not so much interested in the characteristics and quality of this product as in the price he is willing to pay. That is, in this case it is worth talking not about the real price of this product, but about the prestigious one. After all, what is real is the price that a person actually paid for the product, but prestige.
Factors of the law of demand
It will not be a secret to anyone that the main factor on which demand depends is price or the price factor.
But besides price, there are also factors that relate to non-price factors. These factors are:

Patterns of the law of demand
Several arguments can be offered to justify the validity of the law of demand.
1. In the overwhelming majority of cases, there is a so-called price barrier: if the price rises, then for some part of the people the product will be inaccessible, and they will be forced to refuse to buy it; the higher the price, the more people there will be for whom the price barrier will be insurmountable; Sales, widely practiced in all countries, when in order to increase demand the price is sharply reduced, sometimes to the level of the costs of liquidating the goods, can serve as an example of lowering the price barrier.
2. An increase in the volume of demand with a decrease in price can be justified by the resulting income effect. The income effect occurs when a decrease in the price of a good saves a portion of the buyer's income; In this case, the income itself does not change absolutely, but the savings give the buyer the opportunity to purchase an additional quantity of goods with the saved amount of money. For example, if the price of bananas decreases from 30 rubles. up to 20 rubles, the buyer instead of 2 kg of bananas for 60 rubles. will be able to buy 3 kg, although his income has not changed. It grew only relative to the falling price of bananas.
3. An increase in the volume of demand with a decrease in price is also explained by the substitution effect. This effect is related to the problem of choice. If one of two interchangeable goods becomes cheaper, then the buyer will give preference to the cheaper product and reduce purchases of the other, which has become more expensive relative to the first. So, if pears have fallen in price by 1.5 times, and the price of apples has not changed, many consumers will reduce their purchases of apples and buy more pears.
4. An increase in the quantity of demand with a decrease in price can also be explained by the principle of decreasing marginal (additional) utility of a product. Imagine that you are on a hot afternoon on the beach and you are thirsty. Enterprising people will take advantage of this and offer you to buy a bottle of Fanta. The pleasure or utility you get from the first bottle you drink will be very great. The second will bring you less pleasure, that is, its marginal utility will be less; but most of you will agree to buy the third bottle only if it is offered to you at a lower price, since its marginal utility will be very low, and for some it will even become negative.
The considered arguments enable us to explain why the demand curve is directed downwards from left to right, i.e. has a negative slope: a decrease in the price segment on the vertical axis is accompanied by an increase in the segment reflecting the amount of demand on the horizontal axis.
Are there exceptions to this rule?
Giffen effect
The English economist and statistician Robert Giffen (1837-1910) described a situation where an increase in price leads to an increase in the quantity demanded. This situation was called the Giffen effect. He watched as poor working families increased their consumption of potatoes, despite rising prices. The explanation comes down to the fact that potatoes took up a large share of food expenses in poor families. They could rarely afford other food. And if there was an increase in the price of potatoes, the poor family was forced to refuse to buy meat and other nutritious products and spend all their small income on the purchase of goods such as potatoes. The demand curve in this case would have a positive slope.
Other factors affecting demand
By considering the effect of price on quantity demanded, we have simplified the situation compared to what happens in real life. We assumed that other factors that influence the quantity of demand remain unchanged. However, in practice, changes in demand depend on a number of factors that are not related to changes in the price of a given product.
Let's return to our example and assume that in the surveyed group of potential buyers of this product there has been a change in the income of their families: wages have increased. How will this affect the demand scale and schedule?
In the new conditions, the demand scale is shown in Table 3-2.

Consideration of the demand scale allows us to conclude that the pattern of interaction between the quantity of demand and price has been preserved: an increase in price leads to a decrease in the volume of demand. But now each price value corresponds to a larger volume of demand. In conditions of general income growth, more purchases will be made at low, high, and average prices. How will this affect the graph?
Let's construct a new demand curve D "D" next to the previous curve DD.
The graph shows that there has been a shift in the demand curve to the right, indicating a change in demand. We must now make a significant clarification of the two concepts - demand and quantity demanded - and distinguish between them.
A change in the quantity demanded is caused only by a change in the price of a given good and can be illustrated by movement along the points of the demand curve. For example, moving from point A to point B and C on the DD curve shows that a decrease in the price of a good leads to an increase in the quantity demanded.
A change in demand, its increase or decrease, will be reflected in the new position of the demand curve relative to the original one. An increase in demand, for example due to an increase in income, will shift the demand curve to the right, and a decrease in income will lead to a decrease in demand, the demand curve in this case will shift to the left.
What factors lead to a shift in the demand curve, that is, cause an increase or decrease in demand?
1. Income level of buyers. We have already analyzed the influence of this factor. Here we need to clarify that the growth of buyer incomes has a different effect on the demand for different types of goods. There are “inferior” and “normal” goods.
“Inferior” goods include those goods that are purchased, as a rule, by people with low incomes. These are less valuable goods, although their quality may be good. For example, “inferior” goods include cereals, bread, pasta, second-hand goods, shoe repair services, etc.
As household incomes increase, the demand for “inferior” goods decreases, and the demand curve shifts to the left. People buy less bread, margarine, and cereals, replacing them with fruits, vegetables, meat, butter, refuse to repair worn-out shoes, buy new ones, etc.
“Normal” goods are goods that are more valuable, more useful. Their consumption reflects the high level of human well-being. If consumer incomes increase, they increase the purchase of “normal” goods, such as meat, valuable varieties of fish, vegetables, fruits, sports equipment, travel agency services, etc. Demand for them increases, the demand curve shifts up to the right.
2. Tastes and preferences of consumers. Consumer tastes and preferences change quite often. They depend on a successful advertising campaign, educational work (for example, about the dangers of smoking), marketing activities related to sales promotion, the emergence of new products, fashion changes, and the season of the year.
3. The demand for goods will change if the prices of other goods that are in some way related to this product change. In this regard, it is necessary to distinguish between substitute and complementary goods.
Substitute goods are a group of goods that satisfy similar needs. For example, various detergents for washing clothes, certain types of soft drinks, etc. If the price of washing powders increases significantly, the demand for soap will increase, since it will be relatively cheaper. Then the demand curve for soap will shift
to the right. If the price of Pepsi-Cola decreases, the demand for Fanta will decrease and the demand curve for Fanta will shift to the left.
Complementary goods are goods that cannot be consumed one without the other. Examples of complementary goods include cameras and film, tape recorders and cassettes, tennis rackets and tennis balls, etc. If the price of tennis rackets increases, the demand for balls will fall. Then the demand curve for tennis balls will shift to the left.
4. Expectation of changes in income and prices. The demand for goods is related to people's expectations of changes in income and prices. If a decision is made to increase wages in the coming month, then people will begin to buy more goods before their income increases. They will give up part of their savings and make deferred purchases, which will cause an increase in demand for goods.
The same effect is caused by the expectation of rising prices. In this case, people will try to stock up on goods for future use and spend money, which is expected to depreciate in the near future. The demand for goods will increase, regardless of whether they are expensive or cheap.
5. Change in the number of buyers. Demand will increase if there is an increase in the number of buyers. So, if a tray of ice cream is brought to the school building, many schoolchildren passing by will want to buy this delicacy, since they will not have to run to the nearest supermarket during recess. In this case, the demand for ice cream will increase. There will be more purchases of both inexpensive varieties and those that are more expensive.
An increase in the birth rate will cause an increase in demand for children's products.

Ivanov S.I., Sheremetova V.V., Sklyar M.A. and others/Ed. Ivanova S.I. Economics (profile level), grades 10-11, Vita-Press
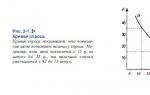
Let's consider the content law of demand and determine the nature of the relationship between price and quantity demanded.
The process of exchange of goods in a competitive market is subject to certain laws. They are manifested in the peculiarities of the economic response of market subjects to the ratio of the quantity of goods exchanged and their prices. Thus, one of the most important economic laws, which reflects the laws of the processes of commodity exchange and pricing in a competitive market, is law of demand.
This law allows us to understand the nature of the functioning of a market economy. reflects logic of buyer behavior in the market.
states that when other things being equal, the higher the price of a product, the less demand for it(i.e., the fewer goods will be purchased by consumers). Conversely, if the price decreases (for example, from P1 to P2), then the number of purchases of this product increases (for example, from Q1 to Q2). The operation of the law of demand can be represented in the form of a graph.
Rice. 1.
The essence of the law of demand manifests itself in inverse relationshipbetween price and quantity of goods purchased.
Demand is a two-pronged concept that connects the quantity of a good purchased with its price.
When the volume of units of a given product on the market increases, then, other things being equal, its sale is possible only at a decreasing price. A slight shortage of products familiar to buyers will cause a tendency for their prices to increase in the markets.
Reflects another important feature of the market behavior of the buyer: gradual decrease in its demand. This means that the reduction in the volume of purchases of these products occurs not only due to rising prices, but also due to satiation of needs.
An increase in purchases of the same product is usually carried out by consumers due to a decrease in its cost. However, the beneficial effect of such an increase has a well-known limit, as it occurs, even with a further decrease in prices for the product, the volume of its purchases is reduced.
This feature of the law of demand finds expression in diminishing utility each additional purchase of products of the same name. The decline is becoming increasingly obvious to the buyer. beneficial consumer effect from the additional costs of these purchases, and a reduction in demand occurs, even despite a decrease in price.
In most market situations, the law of demand is observed. However, there are a number effects(Giffen effect, joining the majority effect, snob effect, Veblen effect), in which the logic of this law is violated.
Understanding the content law of demand allows entrepreneurs to develop the most profitable pricing policy.
Thus, law of demand describes two most important market features:
Inverse relationship between price and quantity of goods purchased;
A gradual decrease in demand for any good exchanged on the market.
Demand (D- from English demand) – the intention of consumers, secured by means of payment, to purchase a given product.
Demand is characterized by its magnitude. Under quantity of demand (Qd) one should understand the quantity of goods that the buyer is willing and able to purchase at a given price in a given period of time.
The presence of demand for a product means the buyer agrees to pay the specified price for it.
Ask price- ϶ᴛᴏ the maximum price that the consumer agrees to pay when purchasing this product.
There is a distinction between individual and aggregate demand. Individual demand is the demand in a given market of a specific buyer for a specific product. Aggregate demand is the total volume of demand for goods and services in the country.
The quantity of demand is influenced by both price and non-price factors, which can be grouped as follows:
- price of the product itself X (Px);
- prices for substitute goods (Pi);
- consumer cash income (Y);
- consumer tastes and preferences (Z);
- consumer expectations (E);
- number of consumers (N)
Then the demand function, characterizing its dependence on these factors, will look like this:
The main factor determining demand is price. A high price of a product limits the amount of demand for that product, and a decrease in price leads to an increase in the amount of demand for it. From the above it follows that the quantity demanded and the price are inversely related.
Based on all of the above, we come to the conclusion that there is a connection between the price and quantity of goods purchased, which is demonstrated in law of demand: ceteris paribus (other factors influencing demand are unchanged), the quantity of a good for which demand is presented increases when the price of this good falls, and vice versa.
Mathematically, the law of demand has the following form: ![]()
Where Qd- the amount of demand for any product; / – factors influencing demand; R- the price of this product.
A change in the quantity of demand for a particular product caused by an increase in its prices can be explained by the following reasons:
1. Substitution effect. If the price of a product increases, consumers try to replace it with a similar product (for example, if the price of beef and pork rises, then the demand for poultry and fish increases) The substitution effect is a change in the structure of demand, which is caused by a decrease in purchases of more expensive goods and replacement its other goods with unchanged prices, since they now become relatively cheaper, and vice versa.
2. Income effect which is expressed in the following: when the price increases, buyers seem to become a little poorer than they were before, and vice versa. For example, if the price of gasoline doubles, then as a result we will have less real income and, naturally, will reduce the consumption of gasoline and other goods. The income effect is a change in the structure of consumer demand caused by a change in income from price changes.
In some cases, certain deviations from the rigid dependence formulated by the law of demand are possible: an increase in price may be accompanied by an increase in the quantity of demand, and a decrease in price may lead to a decrease in the quantity of demand, while at the same time it is possible to maintain stable demand for expensive goods.
These deviations from the law of demand do not contradict it: rising prices can increase the demand for goods if buyers expect their further increase; lower prices may reduce demand if they are expected to fall even further in the future; the acquisition of consistently expensive goods is associated with the desire of consumers to invest their savings profitably.
Demand can be depicted in the form of a table showing the quantity of a good that consumers are willing and able to buy during a certain period. By the way, this dependence is called demand scale.
Example. Let us have a demand scale reflecting the state of affairs on the potato market (Table 3.1)
Table 3.1. Demand for potatoes 
At each market price, consumers will want to buy a certain amount of potatoes. If the price decreases, the quantity demanded will increase, and vice versa.
Based on these data, you can build demand curve.
Axis X let's put aside the quantity of demand (Q), along the axis Y- price (R) The graph shows several options for the demand for potatoes depending on their price.
By connecting these points, we get the demand curve (D), having a negative slope, which indicates an inversely proportional relationship between price and quantity demanded.
Based on all of the above, we come to the conclusion that the demand curve shows that, while other factors influencing demand remain constant, a decrease in price leads to an increase in the quantity demanded, and vice versa, illustrating the law of demand. 
Figure No. 3.1. Demand curve.
The law of demand also reveals another feature - diminishing marginal utility since the decrease in the volume of purchases of goods occurs not only due to an increase in prices, but also as a result of the saturation of the needs of buyers, since each additional unit of the same product has a less and less useful consumer effect.
Offer. Law of supply
The offer characterizes the seller’s willingness to sell a certain quantity of goods.
There are two concepts: supply and quantity supplied.
Sentence (S- sapply) – ϶ᴛᴏ the willingness of producers (sellers) to supply a certain amount of goods or services to the market at a given price.
Supply quantity- ϶ᴛᴏ the maximum quantity of goods and services that producers (sellers) are able and willing to sell at a certain price, in a certain place and at a certain time.
The supply value must always be determined for a specific period of time (day, month, year, etc.)
Similar to demand, the quantity of supply is influenced by many both price and non-price factors, among which the following can be distinguished:
- price of the product itself X(Px);
- resource prices (Pr), used in the production of goods X;
- technology level (L);
- company goals (A);
- amounts of taxes and subsidies (T);
- prices for related goods (Pi);
- Manufacturers' expectations (E);
- number of goods manufacturers (N)
Then the supply function, constructed taking into account these factors, will have the following form:
Do not forget that the most important factor influencing the quantity of supply is the price of the product. The income of sellers and producers depends on the level of market prices, so the higher the price of a given product, the greater the supply, and vice versa.
Offer price- ϶ᴛᴏ the minimum price at which sellers agree to supply this product to the market.
Assuming that all factors except the first remain unchanged:
we get a simplified proposal function: ![]()
Where Q- the amount of supply of goods; R- the price of this product.
The relationship between supply and price is expressed in law of supply the essence of which is essentially that The quantity supplied, other things being equal, changes in direct proportion to the change in price.
The direct response of supply to price is explained by the fact that production responds quite quickly to any changes occurring in the market: when prices increase, commodity producers use reserve capacity or introduce new ones, which leads to an increase in supply. Except for the above, the presence of a tendency towards rising prices attracts other producers to this industry, which further increases production and supply.
Do not forget that it will be important to say, ɥᴛᴏ in short term An increase in supply does not always follow immediately after an increase in price. Everything depends on the available production reserves (availability and workload of equipment, labor, etc.), since the expansion of capacity and the transfer of capital from other industries usually cannot be carried out in a short time. But in long term an increase in supply almost always follows an increase in price.
The graphical relationship between price and quantity supplied is called the supply curve S.
The supply scale and supply curve for a good shows the relationship (other things being equal) between the market price and the quantity of the good that producers want to produce and sell.
Example. Let's say we know how many tons of potatoes can be offered by sellers on the market in a week at different prices.
Table 3.2. Potato offer 
This table shows how many goods will be offered at the minimum and maximum prices.
So, at a price of 5 rubles. For 1 kg of potatoes a minimum quantity will be sold. At such a low price, sellers may sell another product that is more profitable than potatoes. As the price increases, the supply of potatoes will also increase.
Based on the data in the table, a supply curve is constructed S, which shows how much of a good producers would sell at different price levels R(Fig. 3.2) 
Figure No. 3.2. Supply curve.
Changes in demand
A change in demand for a product occurs not only due to changes in prices for it, but also under the influence of other, so-called “non-price” factors. Let's study these factors in more detail.
1. Cash income of consumers. If the monetary income of consumers increases, then the quantity of goods purchased also increases, and vice versa, if the income of buyers decreases, then at the same prices the volume of purchases made decreases. This rule applies to normal goods.
Normal product- a product for which the demand increases with the growth of consumer income.
Inferior commodity- a product for which the demand for which falls as the income of buyers increases, this includes cheap, low-quality things, for example, cheap sausages, low-quality clothing, etc.
2. Prices and availability of other goods and services, among which are interchangeable (substitute goods) and complementary goods (complementary goods) For interchangeable goods, it is characteristic that an increase in the price of one of the goods leads to an increase in demand for the other. For example, an increase in meat prices may cause an increase in the demand for fish, and the demand for tea may increase if coffee is not available to all segments of the population. It is worth saying that for complementary goods, an increase in the price of one product leads to a decrease in demand for another. For example, an increase in gasoline prices will cause a decrease in the demand for cars, and an increase in the price of cameras will lead to a decrease in the demand for photographic film.
3. Tastes and preferences of consumers. The development of production, fashion, cultural and historical features influence the tastes and preferences of people. It is important to know that competition among consumers, consumer psychology (a person strives to buy a product that all his friends buy), etc. also play a big role.
4. Buyer expectations. Here they distinguish: expectations and forecasts associated with possible changes in prices (if prices for some product are expected to rise, then this causes an increase in demand for it at the moment); expectations and forecasts associated with the influence of non-price factors (for example, the expectation of a better quality product)
5. Number of buyers. Obviously, the more people consuming a product, the higher the demand for it. Accordingly, an increase (decrease) in the number of buyers causes an increase (decrease) in demand.
6. Special factors- rains increase the demand for umbrellas, in winter the demand for skis and sleds increases, etc.
When considering demand, it is critical to distinguish between changes in the quantity demanded and demand itself.
Change quantity of demand occurs when the price of a given product changes and is expressed only by movement along the points of the demand curve (along the demand line)
Non-price factors cause changes in the demand for goods regardless of their price level. Graphically, ϶ᴛᴏ may look like this: a change in non-price factors causes the demand curve to shift to the left or right, showing a change in the quantity of goods purchased at the same price.
An increase in demand caused by some non-price factor can be shown by a shift of the entire demand curve to the right and up, and a decrease in consumer demand will be illustrated by a shift of the demand curve to the left and down (Figure 3.3) 
Figure No. 3.3. Shift in the demand curve.
Changes in offer
Changes in supply, as well as demand, are influenced by both price and non-price factors. When the price of a product changes, the starting point of the market situation moves along the supply curve, i.e., a change occurs supply size.
Non-price factors influence changes in the entire supply functions,϶ᴛᴏ can be visually represented as a shift of the supply curve to the right - when supply increases, and to the left - when it decreases (Fig. 3.4) 
Figure No. 3.4. Shift in supply curve.
Let's study in more detail some non-price factors affecting supply.
1. Production costs (or production costs) If production costs are low compared to market prices, then it is profitable for manufacturers to supply goods in large quantities. If they are high compared to the price, firms produce goods in small quantities, switch to other products, or even leave the market.
Production costs are primarily determined prices for economic resources: raw materials, materials, means of production, labor - and technical progress. It is clear that rising resource prices have a major impact on production costs and output levels. For example, when in the 1970s. Oil prices have risen sharply, leading to higher energy prices for producers, increasing their production costs and reducing their supply.
2. Note that production technology. This concept covers everything from genuine technical breakthroughs and better use of existing technologies to the usual reorganization of work processes. Improved technology makes it possible to produce more products with fewer resources. Note that technological progress also allows you to reduce the amount of resources required for the same output. For example, today manufacturers spend much less time producing one car than 10 years ago. Advances in technology allow car manufacturers to profit from producing more cars for the same price.
3. Taxes and subsidies. The effect of taxes and subsidies will be in different directions: increasing taxes leads to an increase in production costs, increasing the price of production and reducing its supply. Tax cuts have the opposite effect. Subsidies and subsidies make it possible to reduce production costs at the expense of the state, thereby contributing to the growth of supply.
4. Prices for related goods. Market supply largely depends on the availability of interchangeable and complementary goods on the market at reasonable prices. For example, the use of artificial raw materials, which are cheaper than natural ones, makes it possible to reduce production costs, thereby increasing the supply of goods.
5. Manufacturers' expectations. Expectations of future price changes for a product may also affect a manufacturer's willingness to supply the product to the market. For example, if a manufacturer expects prices for its products to rise, it can begin to increase production capacity today in the hope of making a profit later and hold the product until prices rise. Information about expected price reductions may lead to an increase in supply now and a decrease in supply in the future.
6. Number of commodity producers. An increase in the number of producers of a given product will lead to an increase in supply, and vice versa.
7. Special factors. For example, certain types of products (skis, roller skates, agricultural products, etc.) are greatly influenced by the weather.
1. Demand is the intention of consumers, secured by means of payment, to purchase a given product. Quantity of demand is the quantity of a good that the buyer is willing and able to purchase at a given price in a given period of time. According to the law of demand, a decrease in price leads to an increase in the quantity demanded, and vice versa.
2. Supply - the willingness of producers (sellers) to supply a certain amount of goods or services to the market at a given price. The quantity of supply is the maximum quantity of goods and services that producers (sellers) are willing to sell at a certain price during a certain period of time. According to the law of supply, an increase in price leads to an increase in the quantity supplied, and vice versa.
3. Changes in demand are caused by both price factors - in this case there is a change in the quantity of demand, which is expressed by movement along the points of the demand curve (along the demand line), and non-price factors, which will lead to a change in the demand function itself. On the graph, ϶ᴛᴏ will be expressed by a shift of the demand curve to the right if demand is growing, and to the left if demand is falling.
4. A change in the price of a given product affects a change in the supply of that product. Graphically, ϶ᴛᴏ can be expressed by moving along the line of the sentence. Non-price factors influence changes in the entire supply function; they can be visually represented as a shift of the supply curve to the right - when supply increases, and to the left - when it decreases.
Let's consider the content law of demand and determine the nature of the relationship between price and quantity demanded.
The process of exchange of goods in a competitive market is subject to certain laws. They are manifested in the peculiarities of the economic response of market subjects to the ratio of the quantity of goods exchanged and their prices. Thus, one of the most important economic laws, which reflects the laws of the processes of commodity exchange and pricing in a competitive market, is law of demand.
This law allows us to understand the nature of the functioning of a market economy. Law of Demand reflects logic of buyer behavior in the market.
Law of Demand states that when other things being equal, the higher the price of a product, the less demand for it(i.e., the fewer goods will be purchased by consumers). Conversely, if the price decreases (for example, from P1 to P2), then the number of purchases of this product increases (for example, from Q1 to Q2). The operation of the law of demand can be represented in the form of a graph.
Rice. 1. Law of Demand
The essence of the law of demand manifests itself in inverse relationship between price and quantity of goods purchased.
Demand is a two-pronged concept that connects the quantity of a good purchased with its price.
When the volume of units of a given product on the market increases, then, other things being equal, its sale is possible only at a decreasing price. A slight shortage of products familiar to buyers will cause a tendency for their prices to increase in the markets.
Law of Demand reflects another important feature of buyer market behavior: gradual decrease in its demand. This means that the reduction in the volume of purchases of these products occurs not only due to rising prices, but also due to satiation of needs.
An increase in purchases of the same product is usually carried out by consumers due to a decrease in its cost. However, the beneficial effect of such an increase has a well-known limit, as it occurs, even with a further decrease in prices for the product, the volume of its purchases is reduced.
This feature of the law of demand finds expression in diminishing utility each additional purchase of products of the same name. The decline is becoming increasingly obvious to the buyer. beneficial consumer effect from the additional costs of these purchases, and a reduction in demand occurs, even despite a decrease in price.
In most market situations, the law of demand is observed. However, there are a number effects(Giffen effect, joining the majority effect, snob effect, Veblen effect), in which the logic of this law is violated.
Thus, law of demand describes two most important market features:
- inverse relationship between price and quantity of goods purchased;
- a gradual decrease in demand for any product exchanged on the market.
Demand. Law of demand. Non-price factors of demand change
Topic 5. Basics of the theory of supply and demand. Consumer behavior
Time: 2 class hours.
Lecture questions:
1. Demand. Law of demand. Non-price factors of demand changes.
2. Offer. Law of supply. Non-price factors of supply changes.
3. Equilibrium price. Market equilibrium mechanism.
4. Elasticity of supply and demand.
5. Principles of consumer behavior.
6. Consumer balance.
Demand is a solvent need, that is, it is the volume of goods and services that consumers are ready and able to buy at a certain price at a given time.
Consider the following hypothetical example. Let’s say that in a given area with a certain number of inhabitants, the following relationship has been established between the price and the quantity of some product that consumers can purchase at different prices (Table 5.1).
The relationship between price and quantity of goods
Let's transfer the table data to the graph (Figure 5.1). Let us plot demand (Q) on the abscissa axis and prices (P) on the ordinate axis. By connecting the dots we get the demand curve (D).
Figure 5.1 – Demand curve
The graph clearly shows that there is an inverse relationship between the price of a product and the quantity demanded, which is reflected by the law of demand: a decrease in price (other things being equal) leads to an increase in demand and vice versa.
But processes can occur in the economy that affect changes in demand without changing the price of the product. Consumers may be willing to buy more or less of a given product at old prices. In these cases, they speak of a change not in volume, but in demand itself. Such changes occur under the influence non-price factors.
To the main non-price determinants of market demand include the following:
1. Consumer preferences (tastes). Favorable changes in consumer preferences increase the demand for a given product, while the demand curve shifts to the right and vice versa. Consumer tastes can change under the influence of advertising, changes in fashion, age, climate, scientific and technological progress, etc.
2. Number of buyers in the market. An increase in the number of consumers of a particular product increases the demand for it, and conversely, a decrease in the number of buyers reduces demand. In this case, the demand curve shifts to the right or left, respectively. The change in the number of buyers in the market may be influenced by the following reasons: the birth rate, the expansion of the boundaries of international markets, changes in life expectancy, etc.
3. Consumer budget or buyer income. If for the bulk of goods an increase in income leads to an increase in demand, then in the case of some products the opposite process is observed. Goods for which the demand is directly dependent on changes in monetary income are called goods of the highest category, and those goods for which demand changes in the opposite direction are called goods of the lowest category.
4. Consumer expectations regarding price changes in the future. Inflationary expectations of the population lead to an increase in demand, and people's confidence in falling prices leads to a reduction in demand.
5. Prices for related goods. There is a direct relationship between the price of one of the interchangeable goods and the demand for the other. For interchangeable goods, the inverse relationship is observed.
Figure 5.2 – Shift of the demand curve to the left
Let’s assume that a factor such as income changes. With increased income, consumers can buy more goods (Qв) at price P 1. It can be assumed that at the price P 2 they will begin to purchase a larger quantity of goods. Consequently, new points reflecting different relationships between Q and P are located to the right of the original demand curve D 1. Therefore, the demand curve shifts to the right. If there is a decrease in demand, the demand curve will shift to the left (D 2)
Therefore, when a shift in the demand curve occurs, we say that the demand for a given product has changed. An increase in demand for a given good means that the demand curve shifts to the right. When demand decreases, the demand curve shifts to the left.
Lecture notes: The law of supply and demand. Market pricing
The interaction of supply and demand forms market equilibrium and equilibrium prices, which is determined by the law of supply and demand: in a competitive market, supply and demand tend to mutually balance, that is, to a situation where exactly the same quantity of goods is offered for sale as is in demand.

At point E at the equilibrium price (Pe), supply and demand are mutually balanced (Qs=Qd). The market is balanced. Buyers and sellers defend their interests.
Too high a price (above the equilibrium price Pe) prevents the formation of demand, since suppliers will want to sell more goods (Qs1) than consumers can buy (Qd1). The result is a surplus, excess supply. If there is an overstock, sellers will be forced to reduce the price so that the surplus is absorbed.
Too low a price excludes profit, since at price P2 (lower than the equilibrium price), indicators could purchase more goods (Qd2) than sellers could supply (Qs2). - shortage of goods. In case of a shortage, there will always be a buyer who can pay a higher price for the necessary thing. These price fluctuations will lead to the restoration of market equilibrium.

Millet and supply rules:
- 1) An increase in demand will cause an increase in both the equilibrium price and the equilibrium quantity of goods.
- 2) A decrease in demand will cause a decrease in the equilibrium price and equilibrium quantity of goods.
- 3) An increase in the supply of goods leads to a decrease in the equilibrium price and an increase in the equilibrium quantity of goods.
- 4) A decrease in the supply of goods leads to an increase in the equilibrium price and a decrease in the equilibrium quantity of goods.
From a reduction in the price of each subsequent unit of goods, the buyer benefits - consumer surplus - the difference between the price that the consumer is willing to pay for the product and the lower price (equilibrium) that he actually pays when purchasing. Sellers whose individual costs are below marginal market prices (below equilibrium prices) receive additional income (additional gain) - seller's rent is the difference between the price at which the producer is willing to supply the product and the higher (equilibrium) price at which he sells it.

Attention! Each electronic lecture notes is the intellectual property of its author and is published on the website for informational purposes only.
Lecture 2. Demand analysis. Elasticity of demand
2.1. The concept of demand. Law of Demand
1. Introduction to the problem of model analysis
The problem of supply and demand as factors determining the market price of goods and services was fundamentally resolved in 1890 in the work of A. Marshall “Principles of Political Economy”. Other economists, in particular L. Walras, who applied a slightly different approach to this problem, also worked on building a model of the interaction of supply and demand. The differences in the developed models will be discussed in detail in this section.
Market pricing is based on the interaction of sellers and buyers, representing supply and demand in the market, respectively.
The purpose of creation The model is the answer to the question of how sellers and buyers make decisions in what quantities to produce and buy goods and services and at what price.
In this case, the market for a particular product or service is considered in a certain period of time.
As already noted, any model is not a mirror image of reality due to the assumptions introduced by economists. For the model of interaction between demand and supply, such assumptions are:
Rational behavior of consumers and producers.
Availability of a fixed price for the sale of each unit of goods.
The presence of a standardized product on the market, devoid of individual differences.
Sellers and buyers cannot influence changes in the price level - the price changes only as a result of the interaction of supply and demand.
2. Law of demand
The term demand is important to economists. Man has a natural desire to consume, but economics deals only with needs that are embodied in solvent demand, that is, demand that matches the desires of consumers with their objective capabilities in purchasing certain goods and services.
So, demand (D – demand)– can be defined as the desire and readiness of consumers to purchase a product.
Quantitatively, demand is expressed in volume of demand (quantity, quantity demanded), which is the maximum quantity of a good that an individual consumer, a group of people or the population as a whole agrees and can buy at a certain price per unit of time (in a certain period of time).
The dependence of the volume of demand on those factors that influence consumer decisions to purchase a given product is called function of demand.
First of all, the volume of demand for a product is determined by its at the cost. It is clear that people usually try to buy cheaper goods. This does not mean, of course, that they are ready to buy low-quality goods and only cheap ones. But no matter how high-quality, technically complex or expensive a product a person buys, there is still an inverse relationship between the price of the product and the amount of demand for it. That is, other things being equal, the lower the price for a product, the greater the demand for a product (and vice versa). This dependency is called law of demand . Thus, the law of demand assumes an inversely proportional relationship between the volume of demand and the price of a given product.
If other factors influencing the volume of demand are taken as constant values, then the indicated dependence of the law of demand will take the form of a function of demand on price:
 ,
,
Schematically, the inversely proportional dependence of the law of demand can be written:
The price demand function can be specified in three ways:
download
SAROV STATE PHYSICAL AND TECHNICAL INSTITUTE
Lecture No. 1 Item. Structure and main functions of economic theory (ET)………3
- Subject and structure of ET.
- Methodology of economic analysis.
- Demand. Law of demand. Demand curve. Movement along the demand curve and shift in the demand curve.
- Offer. Law of supply. Supply curve and supply curve shift.
- Elasticity of demand. Types of elasticity.
- Elasticity of supply
- Marginal costs. Basic rules for maximizing profits and minimizing losses.
- Production function
- Production with one variable factor of production. Law of diminishing returns.
- Concept and main forms of market competition.
- Imperfect competition.
- Basic functions of ET.
- analysis and synthesis.
- induction and deduction.
- analogy.
- method of scientific abstraction.
- modeling
- Objective condition and contradiction of economic development. Economic resources.
- Production possibility curve. Problem of choice.
- The main economic problems facing society and their solutions in economic systems.
- Essence, main elements and functions of the market.
Lecture No. 2 General problem of the economy……………………………………………………. 5
Lecture No. 3 Supply and demand. Market equilibrium…………………………………. 8
Lecture No. 4 Elasticity of supply and demand……………………………………………. eleven
Lecture No. 5
Lecture No. 6 Monopoly and competition
Bibliography
^
Lecture No. 1 from 02.14.07
Item. Structure and main functions of economic theory (ET)
1. In order to live, a person must satisfy his needs for water, food, clothing, housing... The economy is responsible for providing these needs.
Economy– the sphere of human activity is associated with the creation of various goods necessary to satisfy social and personal needs. Economics is as old as human society. How the science appeared in the 18th century and was called political economy. Since the end of the 19th century it has received the name – economics (ET).
The English economist Adam Smith is considered the father of economics as a science. Modern ET is a science that explains the process of choices that people have to make when using limited resources. An ET course usually has two large sections:
Microeconomics– section of ET, which studies the behavior of individual economic entities (households, firms) and the factors that determine it. The foundations of modern microeconomic analysis were laid by the English economist A. Marshall.
Macroeconomics– a section of ET, which considers the national economy as a whole as a unified system that affects people from various sides. The foundations of modern macroeconomic consciousness were laid by the English economist John Keynesy.
2. To study economic processes and phenomena, ET uses various methods. Method– a set of techniques, principles and methods of research.
The most common methods are:
Analysis(decomposition) is a method of cognition consisting in the mental division of the whole into its component parts. Synthesis (compound) is a method consisting of combining individual parts into separate parts into a single whole.
Induction– movement of thought from the particular to the general. Deduction is the movement of thought from the general to the specific.
Analogy– a method of inductive inference, when, based on the similarity of two objects in some parameters, a conclusion is drawn about the similarity of other parameters.
^ Method of scientific abstraction consists in freeing the object under study from random temporary and minor details, highlighting typical properties and characteristics. All cognitive devices rely on the process of abstraction: modeling, classification, hypothesis building, etc.
The most promising research method is modeling. Under modeling understands the process of constructing and using the model.
^ Economic model– a formalized logical, graphic or algebraic description of economic processes or phenomena.
The basic law of economics: “the higher the price, the lower the demand.”
The need to use the modeling method is determined by the fact that many economic processes are completely impossible to study or require a lot of time.
Along with general methods, specific methods are also used that are not typical for other sciences. These include:
— marginal (limit) analysis;
Essence marginal analysis consists in comparing the overall level of benefits and costs from an economic operation, additional benefits and costs associated with this activity.
During functional analysis in the phenomenon under study, the characteristic feature of interest to us is first identified, then the search for factors influencing it begins, and then the method of interrelation is determined, i.e. function.
Aggregation– calculation of combined aggregate macroeconomic indicators or quantities.
The aggregated value characterizes the functioning of the national economy as a whole.
In their reasoning, economists proceed from the hypothesis of rational human behavior. ^ Rational behavior– behavior aimed at achieving maximum results, given existing limitations. It is usually believed that the individual maximizes his needs and actions, firms maximize profits, and the state maximizes social welfare.
3. As a special science, ET performs certain functions
2. explanatory (epistemological)
Lecture No. 2 from 02.21.07
General economic problem
1. The ultimate goal of any economic system is to satisfy the needs of people. The means by which needs are satisfied are called benefits. Some goods are available in unlimited quantities (air). The number of others is limited - economic benefits. To produce economic goods, certain means are needed - resources(factors of production). Economic benefits include:
- Earth
- capital
- enterprise
Earth- these are all natural goods that are used to produce goods and services (land itself, mineral and forest resources, wildlife).
^ Labor is a human activity aimed at creating economic benefits.
Capital in a broad sense - any value that generates income; in the narrow sense - means of production.
Enterprise- this is a person’s ability to most effectively use the first three factors of production.
2. Since our needs are unlimited and our resources are limited, we have to choose which goods and services to produce and which to refuse. What we give up is called opportunity cost. The problem of choice is clearly revealed using a simple economic model - the production possibilities curve.
The production possibilities curve illustrates 4 fundamental principles:
- Limited resources (this is evidenced by the area of unattainable results - point N behind the production possibilities curve).
- The need for choice is illustrated (it is necessary to decide which point on the production possibilities curve will satisfy the needs of the company or society).
- The existence of opportunity costs (shows the downward sloping nature of the production possibilities curve).
- Increased opportunity costs (shows the convex nature of the production possibilities curve).
- In case of incomplete or inefficient use of resources (the economy is at point M, located inside the curve).
- When technology changes (the curve shifts to the right). 3 options:
- What to produce?
- How to produce?
- For whom to produce?
- Traditional economics.
- Planned Economy.
- Market economy.
- Demand
- Offer
- Competition
- Informational – presentation of objective information about the actual value of goods and services.
- Intermediary – the market establishes economic ties between economic entities.
- Pricing – formation of a market price.
- Coordinating – ensuring balance and proportionality of the market economy.
- Controlling – monitoring the efficiency of use of economic resources.
- goods market;
- services market;
- capital market;
- labor market;
- market for information and scientific and technological developments.
- A perfectly competitive market in which the market mechanism operates perfectly.
- an imperfectly competitive market in which the market mechanism may fail.
- Demand and the Law of Diminishing Marginal Utility
- Interaction of supply and demand. Market equilibrium.
- Income level (Y)
- Prices for other goods (Pi…Pn)
- Number of buyers (N)
- Consumer tastes (T)
- inflation expectations (IE)
- Overall usefulness of TU
- Marginal utility MU
- Resource prices (Pj…Pn)
- Technology level (K)
- Taxes and Subsidies (TS)
- Number of suppliers (N)
- Inflation expectations (IE)
- direct price elasticity
- cross price elasticity of demand
- income elasticity of demand.
- on the availability of substitute goods (the more such goods and the closer their basic properties are, the more elastic the demand for a given product.)
- on the variety of possibilities for using a given product (the more diverse the possibilities, the greater the elasticity)
- on the degree of saturation of the need (the greater the degree of saturation of the need, the less the price reduction affects the volume of demand.)
- on the time factor (demand is more elastic in the long run than in the short run)
- essential goods (demand for these goods grows slower than income growth and has a saturation limit)
- essential goods (demand for these goods is growing at the same rate as income)
- Luxury and prestigious consumption items (demand for these goods determines income growth and therefore has no saturation limit)
- on the ability to long-term storage and the cost of storage (the lower the ability to long-term storage and the higher the cost of storage, the lower the elasticity and vice versa)
- on the characteristics of the production process (the faster it is produced, the greater the production volume and the greater the elasticity and vice versa)
- on the time factor (if the producer does not have time to respond to price changes and the supply curve is not elastic)
- The motivation for a firm's behavior is implicit E. and accounting. Arrived.
- Production costs in the short run.
- Long-run production costs.
- Production with 2 variable factors of production. Minimizing costs.
- due to a higher level of specialization of workers (engineering and technical workers and managers).
- due to greater production use of equipment.
- due to more complete recycling of waste
- Perfect competition.
- What are the rules for issuing a work book upon dismissal? Send by mail Issuing a work book upon dismissal is a mandatory procedure when terminating an employment contract with an employee. Before issuing a work book when [...]
- Who receives a social pension in Russia? Over the past few years, during the reform of the pension system of the Russian Federation, both young citizens and older people have heard the concept of “insurance […]
- Colon: where, when and why you need to put a colon So, a colon is a dividing punctuation mark. Unlike a period, exclamation and question marks and ellipses, it does not have a separating […]
If a point is located on a curve, then it shows the maximum possible production of one product given a fixed production of another product and with the best use of production resources. This economic model is based on the concept of opportunity cost - the value of the best alternative that we sacrifice when making a choice. In the domestic literature, the following options are used to denote opportunity cost: HC costs, opportunity costs, choice price.
Economic growth is possible in two main cases:
3. A reflection of the problem of limited resources is the formulation of three main questions of economics:
Depending on how economic systems answer questions, there are three main economic models:
In a traditional economy, resources are distributed in accordance with established traditions.
In a planned economy, resources are allocated by government planning authorities.
In a market economy, resource allocation occurs according to supply and demand. The monetary price of a product acts as a mechanism regulating demand, and the price mechanism regulates production through demand.
However, the economy of most modern states is a mixed economy. It is based on a combination of plan and market.
4. Market economy (ME) is a system based on private property, freedom of choice and competition. It relies on self-interest and limits the role of government. The distribution of resources in a market economy is carried out using the market. Market is an economic mechanism that brings buyers and sellers together. The market is based on 4 main elements:
The main functions of the market are:
Depending on the object of sale and purchase, the following are distinguished: types of market:
Depending on the specifics of competition and pricing:
Lecture No. 3 from 02/28/07
Supply and demand. Market equilibrium.
1. In the most general form, the mechanism of functioning of a market economy is described using such concepts as supply and demand.
Demand– the desire and ability of the consumer to buy a product or service in a given place, at a given time and at a given price. There is a certain cause-and-effect relationship between prices and the quantity of goods and services sold. It shows law of demand: other things being equal, the higher the price, the lower the demand and vice versa. This can be shown graphically in the form of a curve called the “demand curve” (D)
The dependence of the quantity of demand on price can also be written as a function Qдx=f(Px). Besides the price. Other factors also influence demand:
Taking these factors into account, the consumer demand function will take the following form: Qдx=f(Px, Y, Pi…Pn, N, T, IE); Since we are dealing with a simple 2-dimensional graph, the influence of the last 5 variables shows a shift in the demand graph (if demand has increased) to the left (if demand has fallen).
2. The law of diminishing demand, and at the same time consumer behavior, is usually explained using the theory of marginal utility. The theory of marginal utility is based on the assumption that the behavior of an individual buyer in the market for a particular product depends on how his needs are satisfied and what needs a particular product brings. Utility– the satisfaction that a consumer receives from a product or service. There are:
Overall usefulness– satisfaction from the consumption of a certain set of units of a product or service. It is growing, but at a slower pace as consumption increases.
^ Marginal utility– the satisfaction that a consumer derives from one additional unit of a good or service.
Law of decreasing MU: if the consumption of other goods is considered unchanged, then as the consumer’s need for any product or service is saturated, the satisfaction from each subsequent unit of this good falls MU=TUn-TUn-1.
3. Offer- the quantity of goods and services that sellers are willing to sell to buyers in a given place, at a given time and at a given price.
The relationship between prices and the quantity of goods supplied is called the “law of supply”: other things being equal, the higher the price, the more goods and services will be offered on the market and vice versa. This can be shown using a curve called the “supply (S) curve.”
The dependence of the quantity supplied on price can be shown as a function Qsx=f(Px).
In addition to price, other factors also influence supply:
Taking these factors into account, the supply function can be written differently: Qsx=f(Px, Pj…Pn, R, TS, N, IE). The influence of the last 5 variables is shown by shifting the supply graph to the right (if supply grows) or to the left (if it falls).
4. The interaction of supply and demand leads to the establishment of an equilibrium (market) price. In order to establish how the equilibrium price is determined, it is necessary to connect together the supply and demand schedules. The intersection point of the graphs will show the value of the equilibrium price and the equilibrium volume of production.
^ Equilibrium price– this is the price of a product or service at which the volume of demand coincides with the volume of supply.
At any price below the equilibrium, excess demand will push the price up, and at a price above the equilibrium, supply will be excessive, and the price will decrease to the equilibrium level. The force that causes market prices to move toward equilibrium is economic competition. By changing non-price factors that shift supply and demand curves, economists can model various situations that lead to changes in the equilibrium point, equilibrium price and equilibrium output.
Elasticity of supply and demand.
When carrying out economic calculations, very often there is a need to find out how strong the reaction will be. in a specific case, the magnitude of supply and demand for changes in the relevant factors. In order to establish this connection, the concept of elasticity is introduced. The elasticity of supply and demand is their ability to change flexibly under the influence of their determining factors.
1. There are 3 types of elasticity of demand:
Direct price elasticity of demand is the degree of response of commodity demand to a change in price; it shows by how many percent the dimension of demand changes as a result of a change in the price of a product by 1 percent. Measured using the price elasticity of demand coefficient (Unit (Formula))
It is customary to distinguish between point elasticity of demand and arc elasticity of demand. The point elasticity of demand—the value at each point on the demand curve—is determined by the function. Arc elasticity of demand is the average value of demand on any segment of the demand curve. (Formula)
The direct price elasticity depends on:
There are 5 main options for price elasticity of demand:
Cross price elasticity of demand is the degree to which demand for a quantity of a good is responsive to changes in the price of other goods. It shows by what percentage the size (volume) of demand for one product changes as a result of a 1% change in the price of another product. Measured in. coefficient Cross Elasticity (Formula)
Can be positive (>0), negative or =0. If. then the goods are called interchangeable (substitute goods): an increase in the price of one product leads to an increase in the demand for another product and vice versa (n: different types of lemonade). If. then goods are called mutually substituting (complementaries): an increase in the price of one product leads to a decrease in demand for another. (p: skis and ski poles). If. then the goods are called independent: a decrease in the price of one product does not affect the volume of demand for another product (p: bread and cement)
The main factor determining cross price elasticity of demand is the natural properties of goods and their ability to protect each other in consumption. If 2 products can be used equally well to satisfy the same need, then the cross elasticity coefficient will be high and vice versa.
Elasticity of demand and income - the degree of response of commodity demand to changes in consumer income. It shows by how many percent the size (volume) of demand for a quantity of goods will change as a result of a change in consumer income by one percent. It is measured using the income elasticity of demand. .
If. then the product is called normal. As income increases, the demand for such a product increases. Among normal goods, three groups can be distinguished:
If. then the product is of low quality. An increase in income is accompanied by a decrease in demand for this product. Among low-quality goods, the so-called Giffen goods are distinguished, i.e. Such goods are of low quality, on the purchase of which families spend a large part of their family income. The demand curve for such goods has a positive slope.
^ ONE GRAPH IS USE
2. Elasticity of supply
The degree to which sellers react to price changes. It shows by how many percent the quantity supplied will change as a result of a one percent change in the price of a product. It is measured using the elasticity of supply coefficient. FORMULA
The elasticity of supply depends on the following factors:
There are 5 options for supply elasticity
Motivation of the company's behavior. Production costs
At the beginning, the PEM is in effect: as output increases, the average total cost falls. It happens:
Then comes OEM: as production continues to grow, average total costs rise. OEM is explained by the complexity of production management.
There are 3 main options for EM:
B1 – long-term average costs remain unchanged over a long period of time. This means that both small and large firms of the same industry within K1 and K2 can be equally competitive (for example: furniture production, woodworking, etc.)
B2 – PEM operates for a long time. This means that high efficiency can only be achieved by a small number of large enterprises (for example: aluminum, steel, automobile and other heavy industries).
B3 – PEM is quickly replaced by OEM. This means that minimum costs are achieved with a small volume of production, which means that small firms can be more efficient than large ones (for example: retail trade, bakery, clothing, footwear and other areas of light industry)
5. In order to describe the behavior of a company, it is necessary to know how much output it can produce using resources in certain volumes. This dependence of output on inputs is called the production function (PF). In general terms: [FORMULA] Q – production volume; F1, F2... are the factors of production used. Since natural resources in many cases can be considered as a constant factor, the PF often has the form: FORMULA, i.e., output depends only on labor () and capital (). PF shows the maximum output that a firm can produce for each combination of factors of production. PF is applicable only to certain technologies. Since technology improves with the development of society, the volume of production can increase even with a fixed volume of production factors. FORMULA
6. Let us assume that capital is a fixed factor of production and labor is variable. Moreover, the company can increase its output by using more labor resources. Then the behavior of the entrepreneur will be determined by the law of diminishing sequential productivity:
Law of Diminishing Returns (LAR): as the use of any production factor increases (with other factors fixed), a point is gradually reached at which the additional use of this factor leads to a decrease, first in relative and then in absolute output.
The LLA is valid only for a short-term period and is applicable only to certain technologies. As technology improves, the output curve shifts upward.
7. Suppose that a company uses technology in which it can simultaneously change both production factors, labor and capital, then all possible combinations of labor and capital that ensure the same output can be shown using an isoquant (producer indifference curve).
Any point on this curve corresponds to the minimum amount of resource required to obtain a given volume of finished products.
If resources are interchangeable, then the isoquant looks like a concave line (see figure). A set of isoquants is called an isoquant map. Isoquant map – a set of isoquants, each of which shows the maximum output achieved when using certain specific combinations of resources. These volumes increase as they move up and to the right on the chart. The isoquant map is an alternative way to describe the PF.
However, isoquants cannot yet fully explain the choice of the manufacturer, because financial capabilities (budget restrictions) are not taken into account.
Combinations of any two resources that can be purchased with a fixed amount of money shows isocost– manufacturer’s budget line.
Each point on this graph shows all possible combinations of labor and capital that a firm can purchase for a given amount of cash resources. In order to determine the cost minimization point, it is necessary to connect the isoquant and isocost maps together.
Minimization of the costs of production volume Kyu2 will be achieved with a combination of resources Ka1 and El1; All other combinations cannot be selected, because they either correspond to a low production volume, or the company simply does not have enough money to purchase them.
^
Monopoly and competition
1. An important factor dictating the conditions for the functioning of the market is the degree of development of competition. Market competition- the struggle for limited consumer demand, which is waged between firms in the market segment available to them. Competition is a specific mechanism by which a market economy resolves fundamental issues: what, how and for whom to produce.
According to the method of implementation, competition is divided into price and non-price. ^ Price competition- This is competition based on reducing the price of a good. Non-price competition– this is competition, during which the decisive role is played by: product quality, its novelty, reliability, design (design), packaging, technical service, advertising, etc.
Depending on the nature of competition and pricing features, there are two main types of markets:
- a market with perfect competition;
- a market with imperfect competition (there are 3 main types: market of monopolistic competition, market of oligopoly, monopoly market).
2. Models of markets with perfect competition assume the presence of 4 main conditions:
1. homogeneity of products (products in the minds of the consumer are no different, although in reality they may differ).
2. small size and large number of market entities (firms are small and there are many of them).
3. absence of barriers to entry and exit from the market
4. Perfect (ideal) information (sellers and buyers know everything).
A perfectly competitive market is an ideal model that practically never occurs in real life. The closest to it are the product market and the securities market.