Goal cascading method. Sales forecasting and labor motivation. Formation of a tree of strategic goals
Currently, more and more owners and top managers are thinking about those tools and activities that would increase the competitiveness and efficiency of companies and implement the planned strategy.
This article will discuss the experience of implementing projects to implement a management system by objectives using tools that allow you to link the final result of a specific employee with the strategic goals and objectives of the company using the example of the companies “Toyota Center Dnepropetrovsk” and “Lexus Dnepropetrovsk Center”.
One of these strategy implementation tools is the well-known Balanced Scorecard, developed by professors R. Kaplan and D. Norton. This system allows managers to translate the company's strategic goals into a clear plan for the operational activities of departments and key employees, as well as evaluate the results of their activities in terms of strategy implementation, using KPIs.
Another equally well-known tool is the Management by Objective system, which was proposed by Peter Drucker in the 50s. The essence of such management comes down to the decomposition of business goals for each employee at the operational level.
Decomposition is the process of cascading (decomposition) of the company's strategy and goals from its highest level to the lowest. The cascading process involves the sequential transfer of a formed tree of strategic goals and activities to each division of the organization (in the horizontal and vertical direction). The result is created “goal maps” both for individual structural divisions of the company and for positions (vertical integration). And also the process of coordinating data on “goal maps” and activities between departments of the same hierarchy level (horizontal integration). The organizational structure of the company is taken as the basis for cascading.
The project for building and implementing a target management system includes several stages:
1. Formation of a tree of strategic goals.
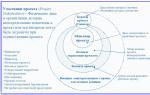
Every company has strategic goals in one form or another. A necessary condition is their clear formalization and the absence of contradictions. The best way to define corporate goals is to formulate them along the lines of business that are needed to implement the strategy. In this case, it is good to use the scheme proposed by D. Norton and R. Kaplan for four components: “Finance”, “Customers and Marketing”, “Business Processes”, “Personnel and Systems” (Figure 2). Answering questions for each perspective allows you to formulate goals and corresponding activities and indicators.
For example, when forming a strategic map at the Toyota Center company (Almaz Motor, Almaz System), a team of top managers and line managers identified about 20 goals for the future (see the table for a fragment of the map).
2. Cascading strategic goals.
After the formation of a tree of strategic goals - “What?”, further clarification of tasks and activities that are aimed at achieving the specified goals occurs - “How?”, and the departments involved in their implementation are also determined - “Who?” (Fig. 3).
Thus, strategic goals and metrics defined at the top level of the organization are used by departments and positions at lower levels to track their contribution to the overall goals of the company. Each goal is formed using SMART technology.
The goals of the units are formed from higher order goals by:
a) including the goals of a higher division in your map, if the division of the next level affects the implementation of this goal (for example, “Fulfill the plan to sell X units of cars in a car dealership” is an integral part of the goal “Fulfill the plan to sell Y units of cars in the region”);
b) duplicating the goals of a higher-level department, but with its own target values (for example, “Increase the active customer base by 20% compared to last year”, “... by 10%”);
c) defining a new goal that is related to the strategic one and influences directly or indirectly its implementation (for example, “Ensure the level of customer satisfaction at + 5% of the network average” is translated into the goal “Comply with the standards established at the enterprise”);
d) combinations of strategic goals that are supported by a given unit and individual goals that are relevant to that department or position and that cannot be formulated on the basis of higher-level goals.
When developing a system of goals and indicators for all levels of the organization, you should not expect that every position will influence all the goals and indicators of the top-level system. An organization creates its value by combining the different skills of all employees in each function.
For example, one of Lexus's founding principles of "pursuit of excellence" is reflected in both its quality vehicle offering and customer service. In order to realize the strategic goal of “increasing customer satisfaction,” the sales department must provide high quality service, highlight all the benefits that the client will receive from owning a car, and the service department must provide high quality after-sales service, offer prompt and profitable solutions to issues. However, all these goals are possible only if the manager can create a team of professionals. And this process includes all stages, from selecting the right people to organizing continuous training and development. Of particular importance is performance management: goal setting, evaluation and feedback.
3. Determination of goals and standards.
The degree of fulfillment of each strategic and individual goal must be measured by certain values, which are expressed in numbers with specific deadlines.
4. Development of measures to achieve goals.
At this stage, specific programs or activities that are necessary to meet target performance standards and achieve a positive result should be developed and identified.
5. Introduction of a target management system.
Based on the developed goals, human and financial resources are distributed, and an area of responsibility for the implementation of tasks and activities is established. The system of goals and indicators is integrated into the organization’s planning and budget system and into management reporting, and a system of material incentives for employees is developed - how much, when, for what and according to what criteria should be paid. As results are determined, a set percentage of remuneration is calculated and paid.
Along with this, I would like to especially note that the formation of a strategy does not at all mean its implementation, as evidenced by statistics from Fortune magazine: “less than 10% of effectively formulated strategies are implemented.”
In order for the “declaration” of strategy to turn into intentions for each employee, it is necessary to implement a set of measures that will be aimed at:
Understanding by the organization’s employees of the strategy and awareness of their own contribution and that of their colleagues in its implementation;
Direct participation of employees in the development of activities necessary to achieve goals within their department or position;
Providing authority and resources to achieve goals;
Motivation to achieve target values;
Using automation tools that make it convenient and easy to plan and monitor the implementation of created “goal cards”.
It is especially important to achieve not only understanding, but also acceptance by employees of the achievability of the goal. People don't like to realize other people's goals. Until the employee agrees, these goals will not be his own, but the manager who set them. Therefore, in addition to the objective justification of challenging goals, the company must necessarily introduce a procedure for discussing and accepting goals by staff. In addition, a procedure for providing feedback on the results of achieving these goals is necessary, since it allows the employee to independently adjust his work in one direction or another, creating a partnership between him and the manager. Thus, it is the key to success in achieving business goals.
Setting achievable goals, objectively assessing an employee’s success, and positive feedback from a manager are strong motivating factors.
Finally, it should also be noted that the development of “goal maps” is never completed “overnight,” just as improving your company is not completed. Since business is affected by external market changes, the competitive environment, and internal transformations in the organization, as these conditions change, existing strategic goals will be tested and “polished” and new ones will be created.
The only question is how to ensure that the developed target management system remains a viable and effective tool that has become an integral part of the company? The answer lies in the key success factors that we achieved as a result of the implementation of projects, namely:
The organization's readiness for change and development;
Availability of a team in the company that is ready to support the system;
Availability of a “healthy” accounting system;
And, of course, there is no substitute for the participation of an energetic and knowledgeable senior executive who can actively use, support and ensure the development of the system as a key tool in managing the company's performance, and implementing the organization's strategies.
_________________________________________________
I don’t know about anyone, but I traditionally devote the first week of the New Year to summing up the results of the past year, as well as planning goals for the coming year. I do this thoughtfully and slowly, but at the same time my sensitivity to everything related to goal setting involuntarily intensifies :). That's why I was particularly intrigued by management consultant Dick Grout's post, "Three Popular Goal-Setting Techniques Managers Should Avoid," published on HBR on January 2.
The note seemed relevant to me both for personal use (it contains universal principles of effective goal setting) and for business consulting (it contains criticism of traditional methods of goal setting SMART, BSC, KPI). That's why I translated it ( not verbatim - paraphrased ;)) I hope it will be useful to you! I already wrote about the seven main mistakes in goal setting in this blog, but Dick Grout’s ideas complement this post very well.
read ==========>
* * *
In 2002, Professors Edwin A. Locke and Gary P. Latham, two of the most renowned academic goal-setting researchers, published ", a summary of their 35 years of research.
Among their findings about setting goals correctly:
- Setting specific, challenging goals consistently leads to higher performance than simply telling people to "do your best";
- High goals generate more effort than low goals, and high or most difficult goals generate the most effort and performance;
- Tight (exact) deadlines encourage you to work at a faster pace than loose (not precisely limited) deadlines;
- Public commitment to achieving a goal increases personal responsibility and effort to achieve it;
- The achievement of the goal is not affected by the way it was set: whether it was set only by the boss, or was established in the process of dialogue between the boss and the employee.
Thus, the importance of setting strategic goals was confirmed. Set specific, but difficult to achieve (“high”) goals, and set aside precise and tight deadlines for achieving them. Don’t pay too much attention to the goal setting procedure: it doesn’t matter whether it will be formulated together with the subordinate, or the subordinate will simply receive from the manager a list of goals/tasks with clear lines. Make your goals public - let everyone know about them. The predictable result of such goal setting: increased effort, greater responsibility, increased productivity.

But many organizations don't follow Locke and Latham's simple advice. Currently extremely popular three goal setting methods, which contradict the conclusions of the professors: 1) setting goals/tasks according to SMART; 2) cascading goals; and 3) using percentage weights to indicate the relative importance of the goal.
* * *
1) SMART goals
Today, almost any manager is familiar with the banal acronym SMART ( although this banality is very deceptive :)) to set goals. Goals should be: Specific, Measurable, Attainable, Realistic and Time-bound. There are many options for decoding and modifications of SMART, but the essence does not change.
There are two main problems with the SMART methodology. Firstly, it was originally intended not for setting goals, but for checking how much already delivered the goal was well formulated. A simple analogy: spelling rules help to detect misspelled words, but do not help to compose the text itself. It’s the same with SMART: the technique helps to assess the quality of goal formulation, but does not guarantee that the goal itself is good and correct. Simply put, a goal can be wonderfully formulated according to SMART, but at the same time it can be completely stupid :).
The second problem is that the SMART methodology encourages people set “low”, too mundane and simple goals. No one will set goals that seem unattainable (A) and unrealistic (R). In addition, any insufficiently motivated and/or competent manager will consciously (or involuntarily) “lower” goals according to these criteria - then it will be easy to achieve guaranteed “success”. That is, the rule of setting “high” goals - difficult, motivating, scalable, etc. will be violated. - which best generate the highest levels of effort and performance.
Tip: use SMART only to check the quality of the formulations of ALREADY set “high” goals.
* * *
2) Cascading goals
Goal setting is often understood as cascading from top to bottom. The boss is supposed to set the goals of the organization. His deputies are assigned goals that follow from the goals of the boss; the goals of deputies are divided into the goals of the heads of business units subordinate to them. And so on, right down to ordinary workers. ( In particular, this approach is used in the BSC strategic management methodology - the Balanced Scorecard, as well as in project management - S.K.)
The very idea of hierarchical (top-down) goal setting is not bad, but there is a problem. The goal setting process becomes too long: No one can begin the goal setting process until their boss has finished formulating his goals. The process drags on endlessly, and everyone blames the “guy one level higher” for the slowdown.
Another problem is that at a certain organizational level/position goals can be unique that do not have a direct and obvious connection with the goals of the superior manager.
Advice: use cascading goals selectively, only in those departments where there really is a direct connection between the goals of the manager and the goals of his subordinates. The manager’s goals (public, open) can be a useful source of information for his subordinates (as an example, sample), but they should not limit the setting of their personal goals.
* * *
3) Using percentages to indicate the importance of a goal
Of course, some goals are more important than others, but specifying the relative importance of goals in percentage terms is counterproductive. Why?
Unable to accurately determine relative importance of goals, for example, with a 5% level of detail. Can one individual goal be valued at 20 or 25 percent of the total weight for all goals? And what is this 5% difference? And if it is necessary to change the significance/weight of the goal, then where, from what other goal, should the additional interest be borrowed? ( I would like to add that I have often encountered a rather strange “percentage” measurement of goals in the KPI system of some companies - S.K.)
You can try to complicate the algorithm for calculating the “percentage of goal importance,” but in general this approach is artificial mathematical manipulation. Quantitative assessment of goals complicates their perception and distracts from the main thing: there is a goal result of a management decision, which is true or false, and has a certain priority for implementation.
Tip: There is no point in assigning a goal weight as a percentage! Instead, it is enough to indicate the priority of the goals (high, medium, low); or simply make a list of goals in rough order of importance (most important to least important).
* * *
In conclusion, it should be said that there is no reliable methodology that allows you to set goals easily and simply. However, Locke and Latham's research confirmed that investing time and thought into goal setting is both worthwhile and necessary. But at the same time, use SMART goal checking correctly; be careful with top-down decomposition of goals (cascading); Do not use percentages to evaluate the importance of goals (replace with a simple prioritization system).
If you liked / found this text useful, be sure to check out "Tips"!
“...Of course, you can also pay from sales. But it’s better to pay people for what they actually do.”
Territory manager of a large tobacco company.
KPIs and cascading goals.
The indicators on which labor incentives with variable pay are based are usually called KPI - Key Performance Indicator - key performance indicators [of labor]. The KPI methodology causes one serious difficulty for the managers who use it: where to get these same KPIs. Of course, there are entire libraries of KPIs. However, the use of ready-made solutions rarely leads to the desired result: it is desirable that this tool be created and adapted to the specifics of the enterprise, division, position and, in some cases, even to an individual employee.
A complex, but truly effective algorithm for the formation of criteria for assessing the performance of personnel and departments provides concept of cascading goals. This algorithm assumes that the final result is formed from the “contributions” of all departments or areas of the business process and, of course, their personnel. A visual analogue of this approach can be a river with its tributaries. But unlike natural systems, the result obtained at the “mouth” of the enterprise must be controllable. And for this it is necessary to manage “influxes”, i.e. contributions of all participants in the process, distributing (decomposing) goals along the management hierarchy and broadcasting (cascading) them “upstream”.
First principle cascading is that all processes in an enterprise must serve to achieve a given final goal or group of goals. The formation of such goals is a matter of company strategy and is beyond the thematic scope of this book. It can be noted that from the point of view of sales and their forecasting, the company's goals need to be linked to the marketing strategy, stage of life, position in the BCG matrix and other guiding frameworks.
Second principle is that the goals of each level of the managerial hierarchy must be necessary, and in totality, sufficient conditions for achieving the goals of the next level of the hierarchy. In other words, the implementation of plans by all employees of the unit must ensure the implementation of the unit's plan.
Third principle- setting goals through agreement. It assumes that the subordinate must be clear about the goals of the next level and its subordinates, as well as the connection between his own activities and their achievement. At the same time, the planned contribution (measurable result or KPI) must be achievable, i.e. correspond to the resources (competencies and powers) of the employee.
Brand manager: “...Our task is to increase sales of the AAA brand from 10,000 to 15,000 units over the year. From 1000 to 2000 units. We will add by increasing the frequency of purchases of the existing audience; we intend to take about 1000 buyers from the BBB substitute, the rest from the BBB substitute. Details and financial boundaries are in the annual marketing plan. How will the sales team meet this additional demand?”
Beginning sales department: “...Based on the existing demand forecast, detailed by time and territory, we must ensure improved distribution in cities G-1 and G-2 for the period of marketing activities: numeric - up to 90% POS with OOS no higher than 30%; high-quality - 100% facing in POS groups p-1 and p-2; placing POSM at points... This may lead to a temporary increase in returns from …% to …%; The trade marketing budget will be up to … units.”
So, within the framework of the cascading concept, goals are set from top to bottom, at each management level being broken down into subgoals corresponding to the resources of the control object and its place in the business process. The goals of a particular employee are his performance indicators (KPIs).
Target cascading technology
In Fig. Figure 1 shows a conditional cascading graph. Red lines show horizontal connections of subcontractors in one division. The lines connecting the levels show that achieving a set of such related goals is a necessary and sufficient condition for achieving the goals of the next level.
Rice. 1
The logic of decomposition is dictated, of course, by a specific business process. In our case, when it comes to marketing and sales management, the most traditional approaches for decomposing goals are the 4P marketing mix, the push-pull concept and a combination of quantitative and qualitative distribution. In Fig. Figure 2 displays this approach as a fragment of a goal decomposition graph.

Rice. 2
In turn, indicators of quantitative and qualitative distribution can be decomposed into measurable components. For example, quantitative distribution is like this:
- actual numeric distribution (the share of points to which deliveries are made in the total number of points);
- out-of-stock (OOS - the proportion of points where a product is out of stock at a certain point in the total number of points to which it was delivered).
High-quality distribution or everything that is called “merchandising” like this:
- place of goods on a display case, shelf;
- exposure quality;
- placement of POS materials, etc.
Of course, in practice, goals should be specified and, if possible, digitized. An effective format for describing goals is the acronym SMART:
- S - Specific: specific (clear, definite);
- M - Measurable: measurable;
- A - Attainable: achievable;
- R - Relevant: relevant (corresponding to top-level goals);
- T - Timed: planned in time.
Of course, sales revenue is not the company's only goal. Cascading the entire set of goals will make it possible to discover at each level of the hierarchy, for each structural unit and employee, how these goals interact, where they complement each other, and where they conflict for resources. An approach called BSC (Balanced Scorecard) allows you to harmonize such a goal-setting system.
B.S.C. Complex goals.
The balanced scorecard suggests that any business activity can be described by four groups of indicators:
- financial indicators;
- customer relationship indicators;
- internal business processes;
- staff development.
Such indicators describing the activities of specific employees or departments must, as already indicated, be specified according to SMART and have clear cause-and-effect relationships with the strategic goals of the enterprise.
Of course, these four groups of indicators are just a diagram reminding us that in addition to the “shaft plan” we must not lose sight of other important areas of activity. Equally useful, especially for describing the tasks of managers, and close in meaning is the PAEI model of Itzhak Adizes. An outstanding consultant and business philosopher describes a manager’s competencies in 4 areas:
- production (value creation);
- administration (organization of order);
- entrepreneurship (search for benefits);
- integration (leadership).
So, the BSC tells us that the company’s goals, if they are not only operational-tactical, but also strategic in nature, must be comprehensive, covering all aspects of the business. And the concept of cascading goals allows you to turn these goals into chains of cause-and-effect relationships along the “vertical” of the management hierarchy and the “horizontal” of the business process.
Thus, in addition to the task of distribution of supplies, the customer service manager may have, for example, the following tasks for the 1st quarter of the plan year:
- formation of a promising client database,
- development of procedures for interaction with the logistics department,
- writing an essay on this book.
And the system of goals for each department and employee will become “three-dimensional” with the following connections for each goal:
- connection between the employee’s personal goals;
- horizontal connections between the goals of subcontractors;
- vertical connections of goals in the management hierarchy.

Rice. 3
In Fig. Figure 3 shows a “three-dimensional” matrix of goals with t.z. an individual employee. Such a comprehensive goal-setting system can not only confuse with its complexity, but can actually scatter the company's resources, including one of the most valuable - the concentrated attention of management. Therefore, a necessary component of such a management system is the technology for determining priorities.
TOC. Setting priorities.
There is never an abundance of resources. A manager constantly has to make decisions about how to more effectively use time, money, materials, and intelligence. “The Pareto principle states that 20% of factors provide 80% of the result. The Theory of Constraints says that the ratio is actually 1% to 99%,” states Oded Cowan, International Director of Goldratt Schools.
The proposed TOC (Theory of Constraints - E. Goldratt's Theory of Constraints) approach allows you to detect areas in the business process and structure that are most obstructive achieving the set goals, and focusing resources and management attention on them. Here is how Oded Cowan describes the algorithm for eliminating system limitations:
Step 1. Find system limitations.
Step 2. Decide how to make the most of the system's limitations (“squeeze” everything possible out of it).
Step 3. Subordinate all other elements of the system to the decision made.
The first three steps are known as “getting your house in order.” They allow the manager to maintain control over the system and increase its reliability and predictability. Once the system is in a stable state, it is ready for focused investment in those areas that will bring the greatest return, that is, for the next step:
Step 4. Extend (extend) the system constraint. This means relieving the stress caused by the constraint by adding capacity (in the case of a capacity constraint), obtaining additional customer orders (in the case of a market constraint), and reducing lead times for orders and projects (in the case of a lead time constraint).
Step 5. If the limitation was resolved in the previous step, return to step 1.
Another quote:
Bottlenecks in the activities of an enterprise can be not only production units, but also management principles, methods and procedures (for example, piecework wages in all areas). An example of a bottleneck in management may be forecasting and planning procedures that do not meet the current needs of the enterprise.
Margarita Chernenko. TOS: in search of the weak link.
Finding a system limitation, its weak link, bottleneck or bottleneck is usually the most difficult of the TOC tasks. But there are also “tips” for solving this complex problem. To begin with, you should look at business as the simplest scheme: an organization that consumes raw materials at the input and sells finished products at the output. Then you can ask simple questions:
- If we increase the supply of necessary raw materials and materials, will the company be able to produce and sell (other things being equal) a correspondingly larger volume of products? A “yes” answer means there is a supply problem.
- Maybe the problem is production volume? Will revenue increase if production volume increases? Will there be problems with raw materials and sales with such growth?
- Or is the biggest problem not supply and production, but sales? If sales start to increase, will the company be able to handle supply and production?
Such a simple analysis will allow you to find out whether the bottleneck is in relations with suppliers or in interaction with the sales market, or in the company’s internal processes. Having discovered a problem area, you can “zoom in” on the analysis. If such a section is sales, you can also divide them into sections and see in a similar way which of them “slows down” the entire system the most:
- demand from the end consumer?
- distribution width?
- supply distribution?
- merchandising?
It is important to consider bottlenecks through the prism of the ratio of additional revenues and additional costs. In this case, we will concentrate on areas whose “expansion” will bring the greatest additional profit (if such are the interests of the company, of course).
Of course, you can find many problem areas in a business process at once. But a more careful consideration will allow us to identify among them the more “narrow” and less “narrow” ones and arrange them according to the hierarchy of relevance.
Kaizen
TOS focuses our attention on the fact that bottlenecks, which are a brake on the entire system, arise either due to losses or due to a lack of resources. The Japanese industrial philosophy of “kaizen” offers us an excellent classification of unproductive costs, combining them into three types: “muda”, “mura”, “muri”.
Muda- “losses” - everything that wastes resources, but does not add value. Kaizen identifies seven types of muda:
1. Defects and defects (products requiring inspection, sorting, disposal, downgrading, replacement or repair).
2. Waiting (interruptions in work associated with waiting for people, materials, equipment or information).
3. Overprocessing (effort that does not add value to the product/service from the consumer's point of view).
4. Unnecessary movements (any movement of people, tools or equipment that does not add value to the final product or service).
5. Overproduction (producing items that no one wants; producing more of a product earlier or faster than required in the next step in the process).
6. Inventories (any excess supply of products into the production process, be it raw materials, semi-finished products or finished products).
7. Transportation (transportation of parts or materials within the enterprise).
Moore- “unevenness” - instability in work methods or process load.
Muri— “overload” — stress (overtime, super-stressful work) of a person or equipment.
Thus, from the point of view resource intensity, removing system restrictions should occur in 2 stages:
- bringing additional resources to the problem area in order to remove the restriction as quickly as possible;
- analysis and gradual reduction of losses in order to reduce the resource intensity of the site.
In this approach, particularly hard or even extra-intense work, requiring extra incentives, bonuses, overtime, is just a temporary way to eliminate primary problems. An obvious addition to extra incentives could be the attraction of additional personnel, especially qualified personnel, or the temporary replacement of less qualified employees with more qualified ones.
Another principle of kaizen is that reform and order are antagonistic processes. Therefore, development must consist of successive stages of changes that introduce imbalance into the process, and stabilizations that preserve the process in a new, improved state.
From this point of view, KPIs can be divided into three types:
1. “Emergency”, associated with the elimination of bottlenecks through emergency changes.
2. Optimizing, associated with reducing unproductive costs.
3. Stabilizing, ensuring the maintenance of normal operation.
The first and second types are used in bottlenecks of the process, the second and third - in the rest.
It should also be noted that financial incentives are an effective, but expensive, cumbersome and risky tool. Understanding the “bottlenecks” and how to solve them allows you to include salary instruments in a broader set of incentives:
- firstly, clear, agreed upon goals, linked into the system and corresponding to both the business process and the qualifications and powers of employees, are in themselves the strongest factor in increasing labor efficiency;
- secondly, it motivates clear control of measured indicators, corresponding in form and intensity to the goals set, their hierarchy of priorities and the status of the employee;
- thirdly, it motivates an objective assessment of labor results, based on a comparison of target and actual indicators, including self-assessment, assessment by subcontractors and by the manager;
- and only fourthly - procedures for penalties and rewards, including bonuses and deductions (fines).
Summary
Now, probably, the place of forecasting in the system of stimulating productive labor has become obvious: forecasts make it possible to formulate adequate goals and identify future bottlenecks, on which the entire management system described above is based. It remains to add that priorities determine the weight of KPIs for calculating the final assessment of work for the period.
So here's a short summary of the algorithm described in this chapter, "embedded" in the management cycle:
1. Forecast opportunities and threats for the planning period using calculation and expert methods. In sales - analysis of 5 influencing factors, plus BDI, plus analysis of the quantity and quality of distribution. Search and analysis of restrictions.
2. Planning. Determine ways to eliminate restrictions. Prioritization.
3. Management. Cascading goals. Recording KPIs, their connections with penalties and rewards.
4. Summing up. Control, assessment, penalties and rewards.
Let's see what a goal map for a territory manager might look like:
Obstacle to growth, priority No. 1: the distribution width of brand “C” is half the target. The company's estimated losses are CU 1.2-1.5 million. in year.
Source of losses, priority No. 2: up to 1/3 of invoices are returned to the accounting department after deadlines. Estimated tax risks and internal losses of the company are up to CU 300 thousand. in year.
Source of losses, priority No. 3: unit costs for merchandising in the territory are 40% higher than the national average; total excess - up to 150 thousand units. in year.
All goals and indicators for the period:
|
group |
description | ||
|
Financial |
Emergency |
increase the distribution width of brand “C” to 70% in total in the territory, incl. in city X - up to 90%, in city Y - up to 80% | |
|
Process |
Optimizing |
bring the return of issued expense invoices to the accounting department on time to 90% | |
|
Financial |
Optimizing |
reduce unit merchandising costs by 25% | |
|
Financial |
Stabilizing |
Keep the average duration of receivables no higher than 90 days and the number of payments with a duration of 90 to 120 days no higher than 10% | |
|
Financial |
Stabilizing |
Keep OOS no higher than 20% for all brands at any time of measurement | |
|
Financial |
Stabilizing |
Maintain the quality of merchandising within the standard | |
|
Client |
Stabilizing | ||
|
Developmental |
Optimizing |
Conduct quarterly staff assessments. |
The loyalty of employees of any company increases if they are familiar with its strategy and imagine their small contribution to its implementation. An example of the embodiment of this idea could be a large organization called the Soviet Union: the strategic goal of building socialism was known to everyone, and the ordinary miner clearly understood that the tons of coal he mined per unit of time were necessary to achieve it.
The very fact of communicating the strategy motivates employees (“I understand where we are going and what will happen to the company in three years”). Additional motivation appears when an employee knows what he personally must do to achieve a common goal. A tool that helps communicate the company's strategy to everyone can be cascading goals in the Balanced Scorecard system.
A typical problem of strategic management is ignorance of strategy by those who are called upon to implement it. Of course, the mere fact of awareness does not mean that each employee will evaluate his actions in terms of benefits for the common cause. You can increase the willingness of personnel to participate in the implementation of the strategy if you involve them in the development of activities aimed at achieving the company’s strategic goals, as well as if you link material and non-material motivation to the achievement of strategic goals. In other words, an employee will be focused on implementing the company’s strategy if he:
- knows and understands the company's strategy as a whole;
- sees his contribution to the implementation of the strategy;
- represents the contribution of colleagues to the implementation of the strategy;
- participated in the development of activities necessary to achieve strategic goals;
- participated in drawing up a system of goals and indicators for his structural unit (position);
- motivated (financially and/or immaterially) to achieve target values of accepted indicators;
- has the resources, knowledge, skills and infrastructure necessary to achieve its objectives.
The Balanced Scorecard (BSC) system was developed by Professors Kaplan and Norton specifically as a strategy implementation tool. After identifying key goals in the “finance”, “clients”, “business processes” and “infrastructure/personnel” projections, a set of indicators is developed to monitor their achievement and target values for these indicators are set. Next, they think through the main activities aimed at achieving the goals. The basic version of the BSS system is presented in table. 1. And the extended one includes indicators not only for goals, but also for activities, it involves indicating the units involved in their implementation, as well as budgets and timing for their implementation (Table 2).
Table 1. Basic version of the Balanced Scorecard system
(company - Internet provider)
It must be remembered that this or that goal (for example, “to ensure an influx of new customers”) is achieved not only through special events. It is also necessary to take into account the impact of activities related to other goals of the same projection and to the goals of other projections (for example, “business processes” and “infrastructure/personnel”). At the same time, repeated mention of a particular event in the general list in the context of different goals violates the principle of compactness - one of the key ones when building a BSC system. Therefore, it is recommended to relate this or that event to one goal - the one to which it contributes to the greatest extent.
Table 2. An expanded version of the Balanced Scorecard system
(company - manufacturer of building structures) 
The BSC system option shown in table. 2, explains to individual structural units exactly what activities necessary to achieve strategic goals they are participating in and by what indicators the results of these activities will be assessed. It also contains information about the budget of individual activities and the timing of their implementation.
There is, however, a more detailed version of BSC, which involves building a system of goals, indicators and activities for individual structural units (that is, cascading). As a result, each structural unit of the company (department, branch, division, etc.) has its own BSC system (“map”), reflecting the key goals of these units, their indicators and activities necessary to achieve them. The “map” explains to staff their participation in the implementation of the company’s strategy, helps management evaluate the work of each employee (division) and serves as the basis for the motivation system.
Let's consider the main problems faced by companies that decide to cascade the BSC system to the levels of structural divisions and below.
PROJECTIONS AT THE LEVEL OF STRUCTURAL DIVISIONS
Typically, a top-level BSC system presents four perspectives: finance, customers, business processes, and infrastructure/personnel. The overall goals of the company, formulated within the framework of these projections, usually form a chain of cause and effect. The logic of the reasoning is that qualified and motivated employees, using a developed infrastructure (equipment, software, transport fleet, etc.), are able to provide the quality and speed of business processes required by the company. Streamlined business processes provide an advantage over competitors and contribute to customer satisfaction. Satisfied customers and competitive advantages, in turn, are prerequisites for achieving financial goals (Fig. 1).

Picture 1. Cause-and-effect chains of goals in the BSC system
How to apply this in practice? Goals in the top-level “map” are written starting from the “finance” projection. First of all, the company must answer the question: “How much do we want to earn and how much are we going to spend?” The second question is: “What must we do for our clients to achieve their financial goals?” The third concerns the “business processes” projection: “How should the company’s work be structured in order to achieve goals within the framework of the “customer” and “finance” projections?” And finally, the fourth question is about what personnel and infrastructure the company needs to achieve the goals within the top three projections.
As for the number of projections at the company level as a whole, in practice it may vary. As a rule, we are talking about isolating an aspect that is particularly significant for the company into a separate projection (for example, “suppliers”, “government”) and adding it to the four “classic” ones. Of course, if desired, the company’s relations with suppliers can be viewed in the “Business Processes” projection, and with the state - in the “market/clients” projection.
The BSC system at the level of structural divisions usually repeats its model at the level of the company as a whole. Each division usually has its own “finances” (for example, the department’s budget and the amount allocated for bonuses), its own “clients” (colleagues), its own “business processes” (“global” processes of the company as a whole, in which the structural unit participates , and “local” processes occurring within a structural unit), as well as its own “infrastructure/personnel”. Thus, the BSC system turns a structural unit (production department, logistics department, financial department, IT department, etc.) into a mini-company within the company. Each structural unit understands that it needs qualified personnel and developed infrastructure in order to quickly and efficiently carry out its work (the “business processes” projection). Well-functioning processes are necessary for a structural unit to successfully interact with internal clients (colleagues from other departments or company management). The financial results of the department (compliance with the budget, receipt of the planned bonus amount) also depend on how successful this interaction is. In other words, each structural division of the company sells its product (service) to internal (and external) customers, trying to satisfy their expectations as much as possible. Therefore, the internal customer satisfaction index (colleague score) in companies based on this business logic is a standard indicator in almost all departments.
Modifications of the “classic” BSC model for structural units are also possible. For example, in the BSC system of one of the Eastern European plants of a large automotive concern there are only three projections: “finance”, “business processes” and “infrastructure/personnel”. The “clients” projection drops out: the plant itself should not look for clients, since all orders come to it from the concern, and interaction with third-party clients is not provided for in the business model. Strictly speaking, the clients of this plant are other enterprises of the concern to which it supplies its products (car parts). But the plant management considered that it was possible to track aspects of relations with other enterprises within the concern within the framework of the “business processes” projection. The main indicators that were analyzed were the percentage of defects, the number of orders completed on time, and the number of complaints from internal customers.
To be continued